
Overview
KoboToolbox Dashboards hosts live dashboards of KoboToolbox projects at https://dash.kobolabs.dev. You design a dashboard with your AI assistant, through the KoboToolbox MCP server, or in this site's layout editor, or both. This site keeps a copy of the project's submissions, refreshed on the schedule you choose, and works out every chart and number from it. Your assistant can also research other sources and write cited text about them beside your numbers (see Desk research and narratives).
Dashboards work with projects on the Global server (kf.kobotoolbox.org) and the EU server (eu.kobotoolbox.org), and only for projects you own, or have Manage project permission on.
Get started
1. Connect your assistant to KoboToolbox
Set up the KoboToolbox connector in Claude or another MCP client: see Connect on https://mcp.kobolabs.dev. That is also how you sign in here: Sign in takes you to the connector's sign-in page, which checks your KoboToolbox API token and tells this site who you are. The token stays with the connector.
2. Make a dashboard account
This site reads your projects through a separate KoboToolbox account that you share them with, view-only. So it never holds a token that can change your data or reach projects you didn't share.
- Create a second KoboToolbox account on the same server, for example
you_dash, used only for dashboards. - Sign in to KoboToolbox as that account, and copy its API token from Account Settings → Security.
- Sign in here with your own account, and paste the token under Kobo access. It's stored encrypted, and shown again only as the account's name.
You don't share projects with the dashboard account yourself: the assistant does it, view-only, when it makes a dashboard, and tells you first. If the account can do more than view a project, the assistant says so.
Make a dashboard
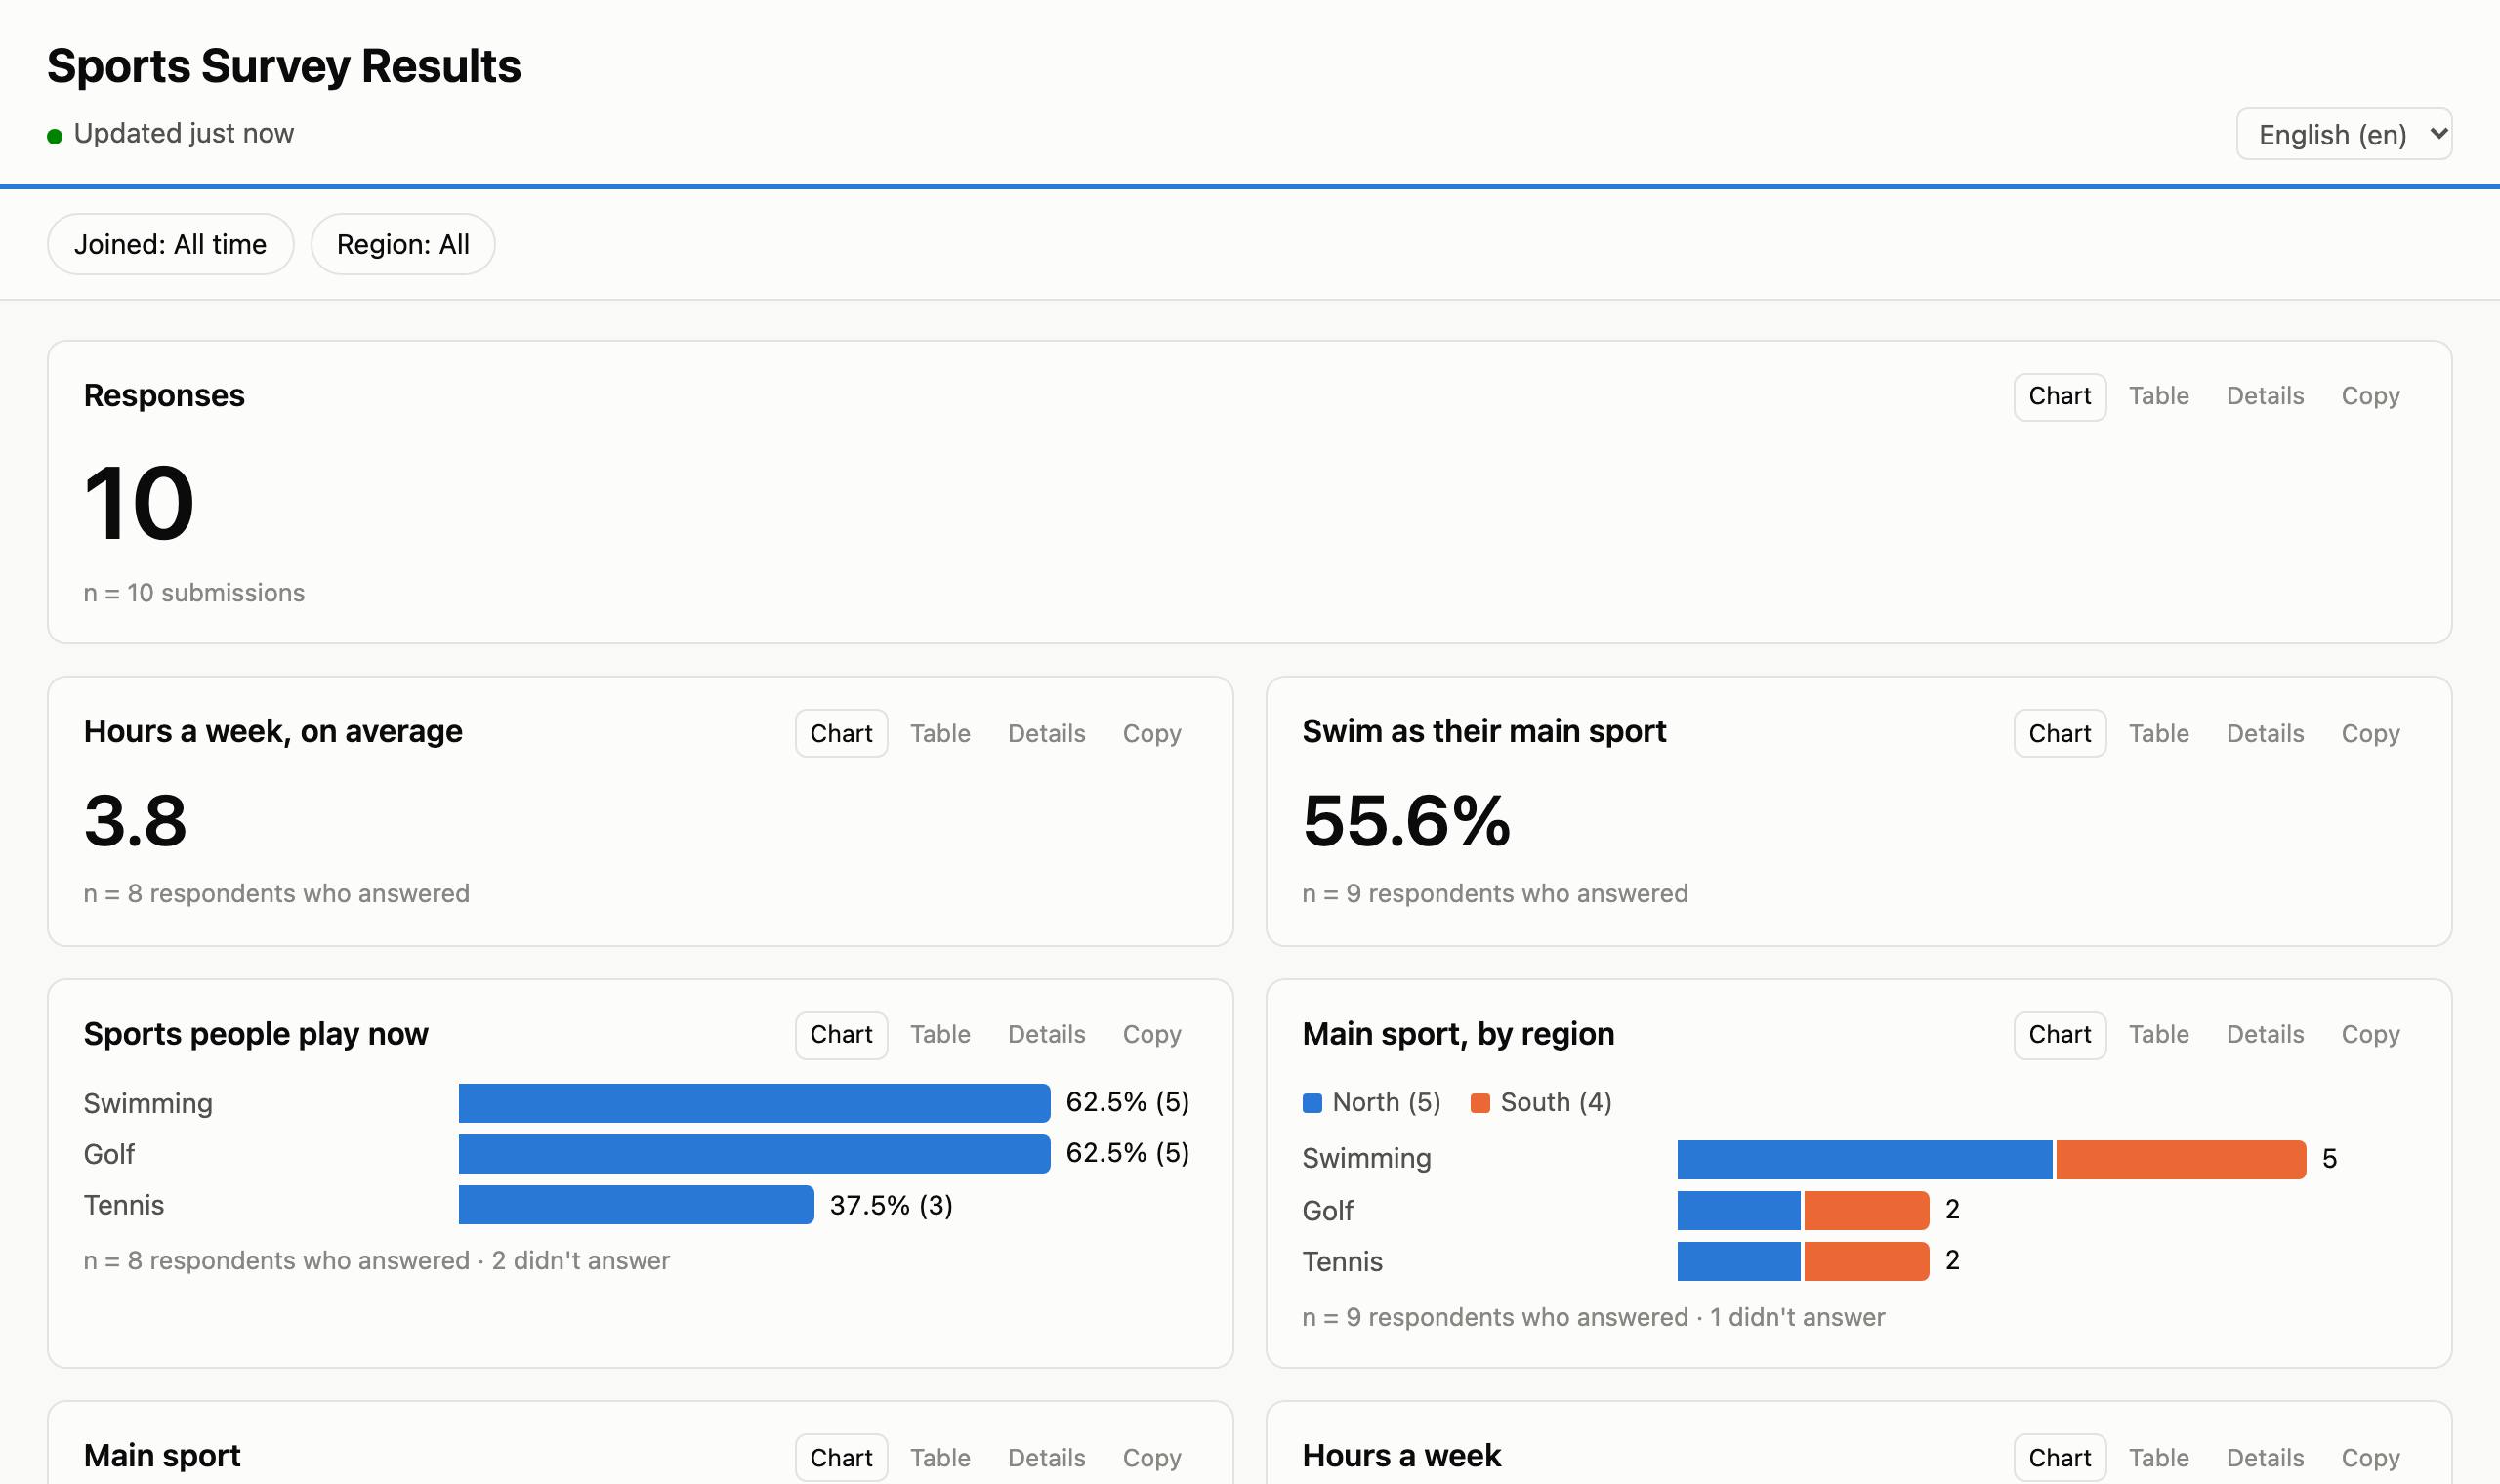
Ask your assistant: Make a dashboard of my sports survey.
It checks that you own the project, or manage it, and shows what it is about to do. Then it shares the project with your dashboard account, view-only, and makes a first layout from the form:
- a count of responses and a timeline of submissions;
- a bar chart for each choice question, and averages for number questions;
- a timeline for dates, and a map for locations.
A new dashboard starts offline: nobody can open it until you choose who may. Change it in conversation (put the region chart first and add a table of comments
) or in the layout editor. Every change is kept, so undo that
or Restore in the settings' History brings an earlier layout back.
What you can ask
Write as you would to a colleague; the assistant picks the tools. Each prompt below lists the tools it should use.
Make a dashboard of my sports survey, with a filter on region and on the submission date.
create_dashboard,update_dashboardShow submissions by validation status as tiles, with “Not validated” for the ones nobody has checked.
update_dashboardAdd my round 2 project, merge it with round 1, and compare the rounds.
add_dashboard_source,describe_dashboard_sources,preview_dataset,update_dashboardGroup ages into under 18, 18–34, 35–59 and 60 or more, and chart them by sex.
update_dashboardWhich county is each submission's location in? Chart them, and shade a map of Kenya's counties.
fetch_dashboard_boundaries,update_dashboardAdd a number for interviews done, with a target of 500, and the average interview length in minutes.
update_dashboardWhen someone hovers over a district, show the average household size and the share of households headed by a woman.
update_dashboardOnly count approved submissions, and hide groups smaller than 5.
update_dashboardGive the dashboard the ocean style, always in dark mode.
update_dashboardTurn the dashboard into a story for our donors. Show me the outline first.
get_dashboard,generate_dashboard_layout,update_dashboardIn the water chapter, zoom the map to the three counties with most answers, one step each.
update_dashboardMake it public, but first tell me what it shows as written.
get_dashboard,set_dashboard_settingsWhat does the dashboard show right now? Summarise it for my report.
get_dashboard_dataUndo the last change to the layout.
list_dashboard_revisions,revert_dashboardDo a desk review on water and shelter for this dashboard: find recent OCHA and IOM figures, compare them with the survey, and write a short cited narrative.
get_narrative_context,save_evidence,update_dashboard,publish_narrativeWhich published texts need another look since the new data came in?
get_dashboard,get_narrative_context
Widgets
Every chart has Chart, Table and Details tabs and a Copy button for its numbers. It also says how many submissions or respondents its numbers are based on.
| Widget | Shows |
|---|---|
| Number | A count, a percentage choosing an answer, an average, median, total, lowest or highest, the most common answer, an average on an ordered scale, or one total over another. Optionally with progress towards a target. |
| Bar chart | How often each answer was given: the top answers, in count, form or alphabetical order. Split by a second question gives grouped or stacked bars, for example age groups by sex. Ordered scales (never … always) are shaded light to dark. |
| Donut | Shares of a single-choice question, up to 6 slices plus “Other”. |
| Tiles | A number tile for each answer, with its share: for a few categories that matter on their own, such as validation status. |
| Histogram | How a number question's answers are spread. |
| Timeline | Submissions, or any date, per day, week or month, or as a running total. |
| Table | Chosen answers row by row, with search, sorting and paging. |
| Likert matrix | Several questions on one scale (disagree … agree), a 100% bar each. |
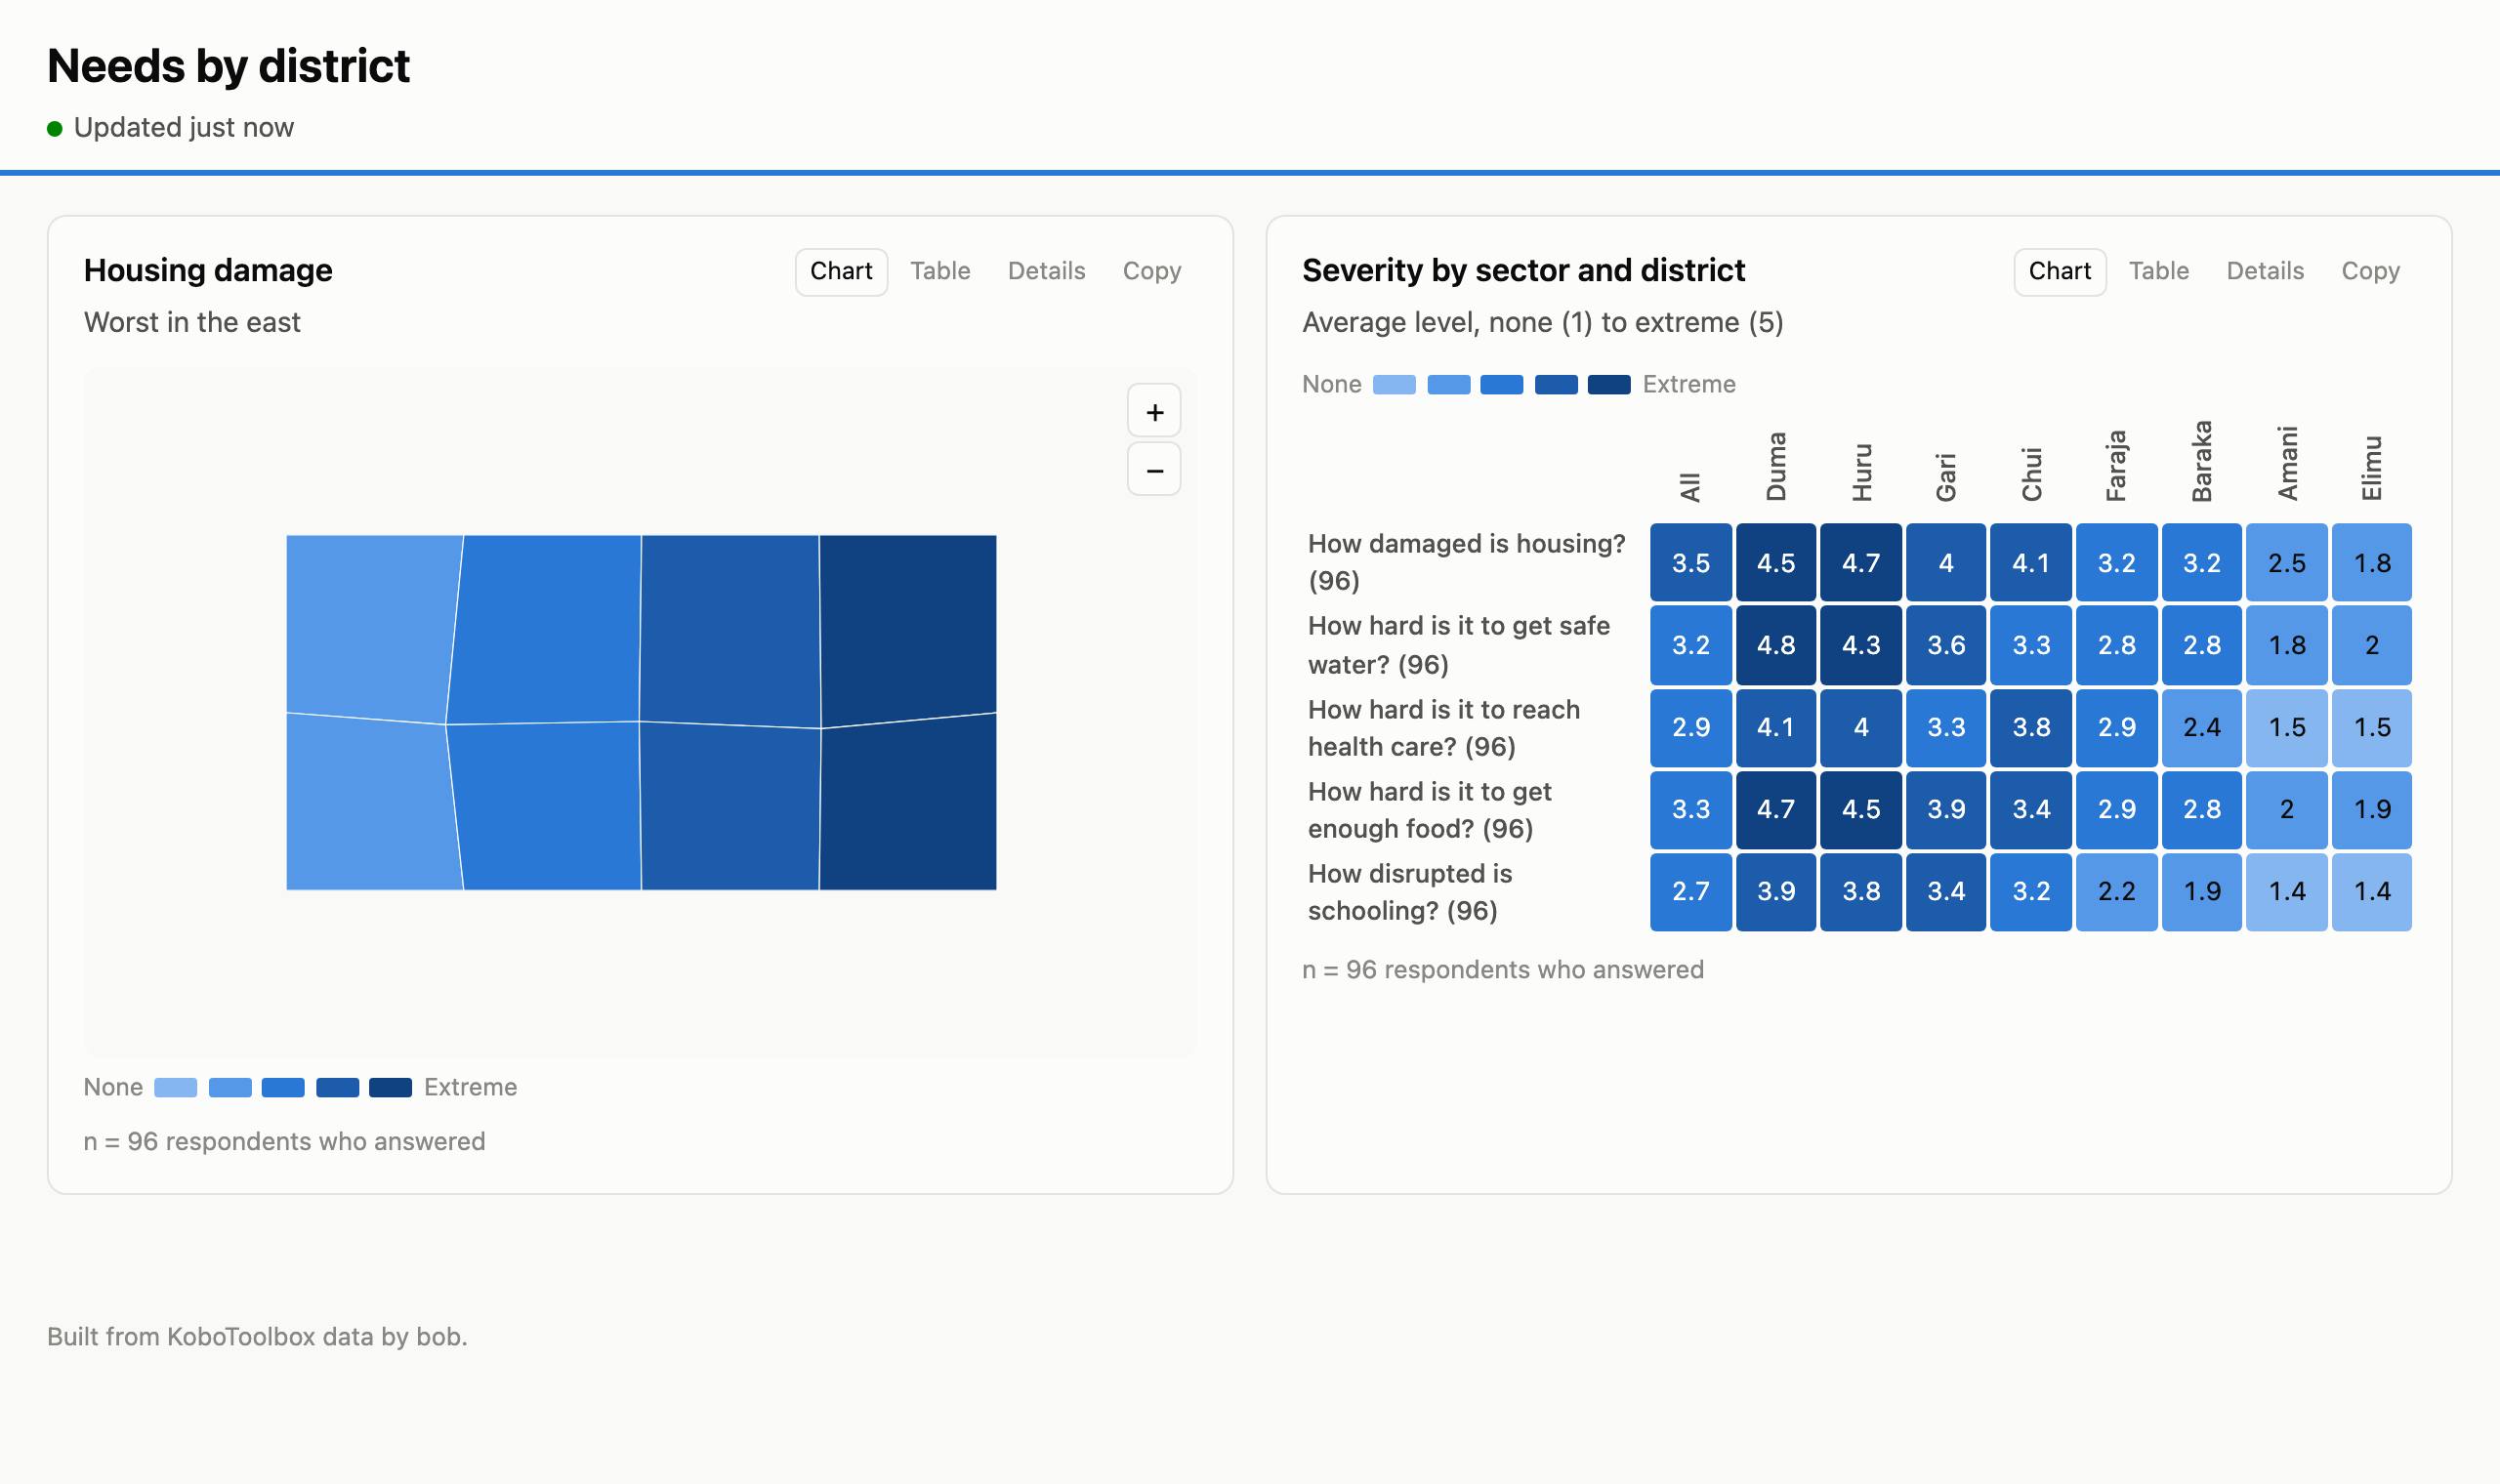
| Heatmap | Several questions across the answers of another, a cell each: for example how severe each sector's needs are in each state. A cell shows an average on an ordered scale, an average, median, total, lowest or highest, or the share choosing an answer, with its value written in it. On an ordered scale, each row is shaded by its place on its own scale, so a colour means the same level in every row. Columns can be sorted by value, and an “All” column added; click one to filter the rest of the page by it. |
| Ranking | 1st, 2nd and 3rd choices scored together (Borda), for “rank your top three” questions. |
| Point map | Where submissions came from, grouped to about 1 km by default, on an OpenStreetMap street map. |
| Area map | Areas shaded by how many answers name them, from a map layer of your areas, or by a measure of each area's own answers: the average level of an ordered question (how damaged is housing?), an average, or the share choosing an answer. An ordered scale keeps its colours on every view, so the darkest areas are always the highest level, whatever is filtered. |
| Text | Headings and notes, in Markdown. |
| Custom HTML | Your own design, in a sandbox, fed with the numbers of the widgets it names and the page's colours, so it can match the style. In a story, it's also told each step as the reader gets there. |
| Image | A photo you uploaded in the settings, with its alt text, a caption and a credit. |
| About this data | Where the numbers come from, written out: how many submissions are counted and which are left out, as of when, how often it's updated, the smallest group shown, and what the calculated fields mean. |
Every chart and number can have a subtitle, its point in a line above it; text can be a lede, a callout, a caveat or a pull quote.
Tooltips: hovering a bar, slice, tile, area, cell or dot shows its numbers. You can choose which ones, and in what order, rename them (“households” instead of “respondents”), or turn the tooltip off. You can also add up to 4 values worked out from that mark's own submissions, such as the average age of those who chose an answer or the share of women in each district. The extra values are also columns in the chart's Table tab, and groups smaller than the minimum group size are hidden.
Any widget can have its own conditions (only adults, only the north) and a minimum group size. A dashboard can have several pages, shown as tabs, and its own title, logo, style, light or dark mode, accent colour and default language. Viewers can switch between the form's languages.
Calculated fields
A calculated field works something out from each submission's answers. Use it anywhere a question goes: in charts, numbers, tiles, filters, splits and conditions. Ask for one in plain words, or add it in the layout editor from a starting point.
| Kind | Gives | For example |
|---|---|---|
| Categories from conditions | The first category whose conditions hold, else a fallback | Approved / On hold / Not validated; districts grouped into regions |
| Number bands | A category per range of a number | Age groups; household size 1–2, 3–5, 6 or more |
| Sum, difference, ratio | A number from other numbers | Household members = adults + children; girls as a percentage of pupils |
| Number of choices | How many options a multiple-choice answer picked | How many sports each person plays |
| Time between | Minutes, hours or days between two date-times | Interview length from start to end; days from visit to submission |
| Area from location | The area a geopoint lies in | County, district or region of each submission (see below) |
A bar chart, donut or tiles can also count unanswered submissions as a category of their own, such as “Not validated”.
Areas from locations
To group submissions by place, a dashboard needs a map layer of areas. Then an Area from location field finds the area each submission's geopoint lies in. You can chart it, tile it, filter by it, or shade an area map with it.
- Get a country's administrative areas in the dashboard's settings, under Map layers: give the country codes (
KEN, orKEN, UGA) and a level, from the country itself down to sub-districts. Or ask your assistant. The boundaries come from geoBoundaries, which publishes open boundary data for every country. - Or add the world map for a question that lists countries: the countries of the world, every one but Antarctica, joined on the choices' two-letter (
KE) or three-letter (KEN) ISO codes. It comes with this site, from Natural Earth (public domain), so nothing is fetched. - Or upload your own GeoJSON, naming the property that holds each area's code: for example P-codes that your form's choices also use.
- No location leaves this site. The matching is done here, on the server; geoBoundaries only receives the country codes you asked for.
Filters and cross-filtering
- Filters sit above the charts and apply to every widget: choices of a question, a date range or a number range. Viewers set them; you choose which there are.
- Cross-filtering: viewers click a bar, a donut slice, a tile or an area, and everything else on the dashboard shows only those submissions. Clicking “Male” on a sex chart, for example, filters every other chart to men. The clicked chart stays whole and marks the pick. Picks on several charts combine, and the chips above the charts clear them. You can turn it off for a dashboard.
- Breakdowns: split a bar chart by a second question for a breakdown with percentages within each group, such as age groups by sex or main sport by region.
- For the whole dashboard: count only approved submissions, and hide groups smaller than a size you choose (5 is common for public dashboards), so small groups can't identify people.
Combining projects
A dashboard can read several projects you own or manage, and tables you upload, and combine them. Ask your assistant: Add my round 2 project to this dashboard, merge it with round 1, and link it to the beneficiary list.
The Combine projects prompt in the KoboToolbox connector walks it through this.
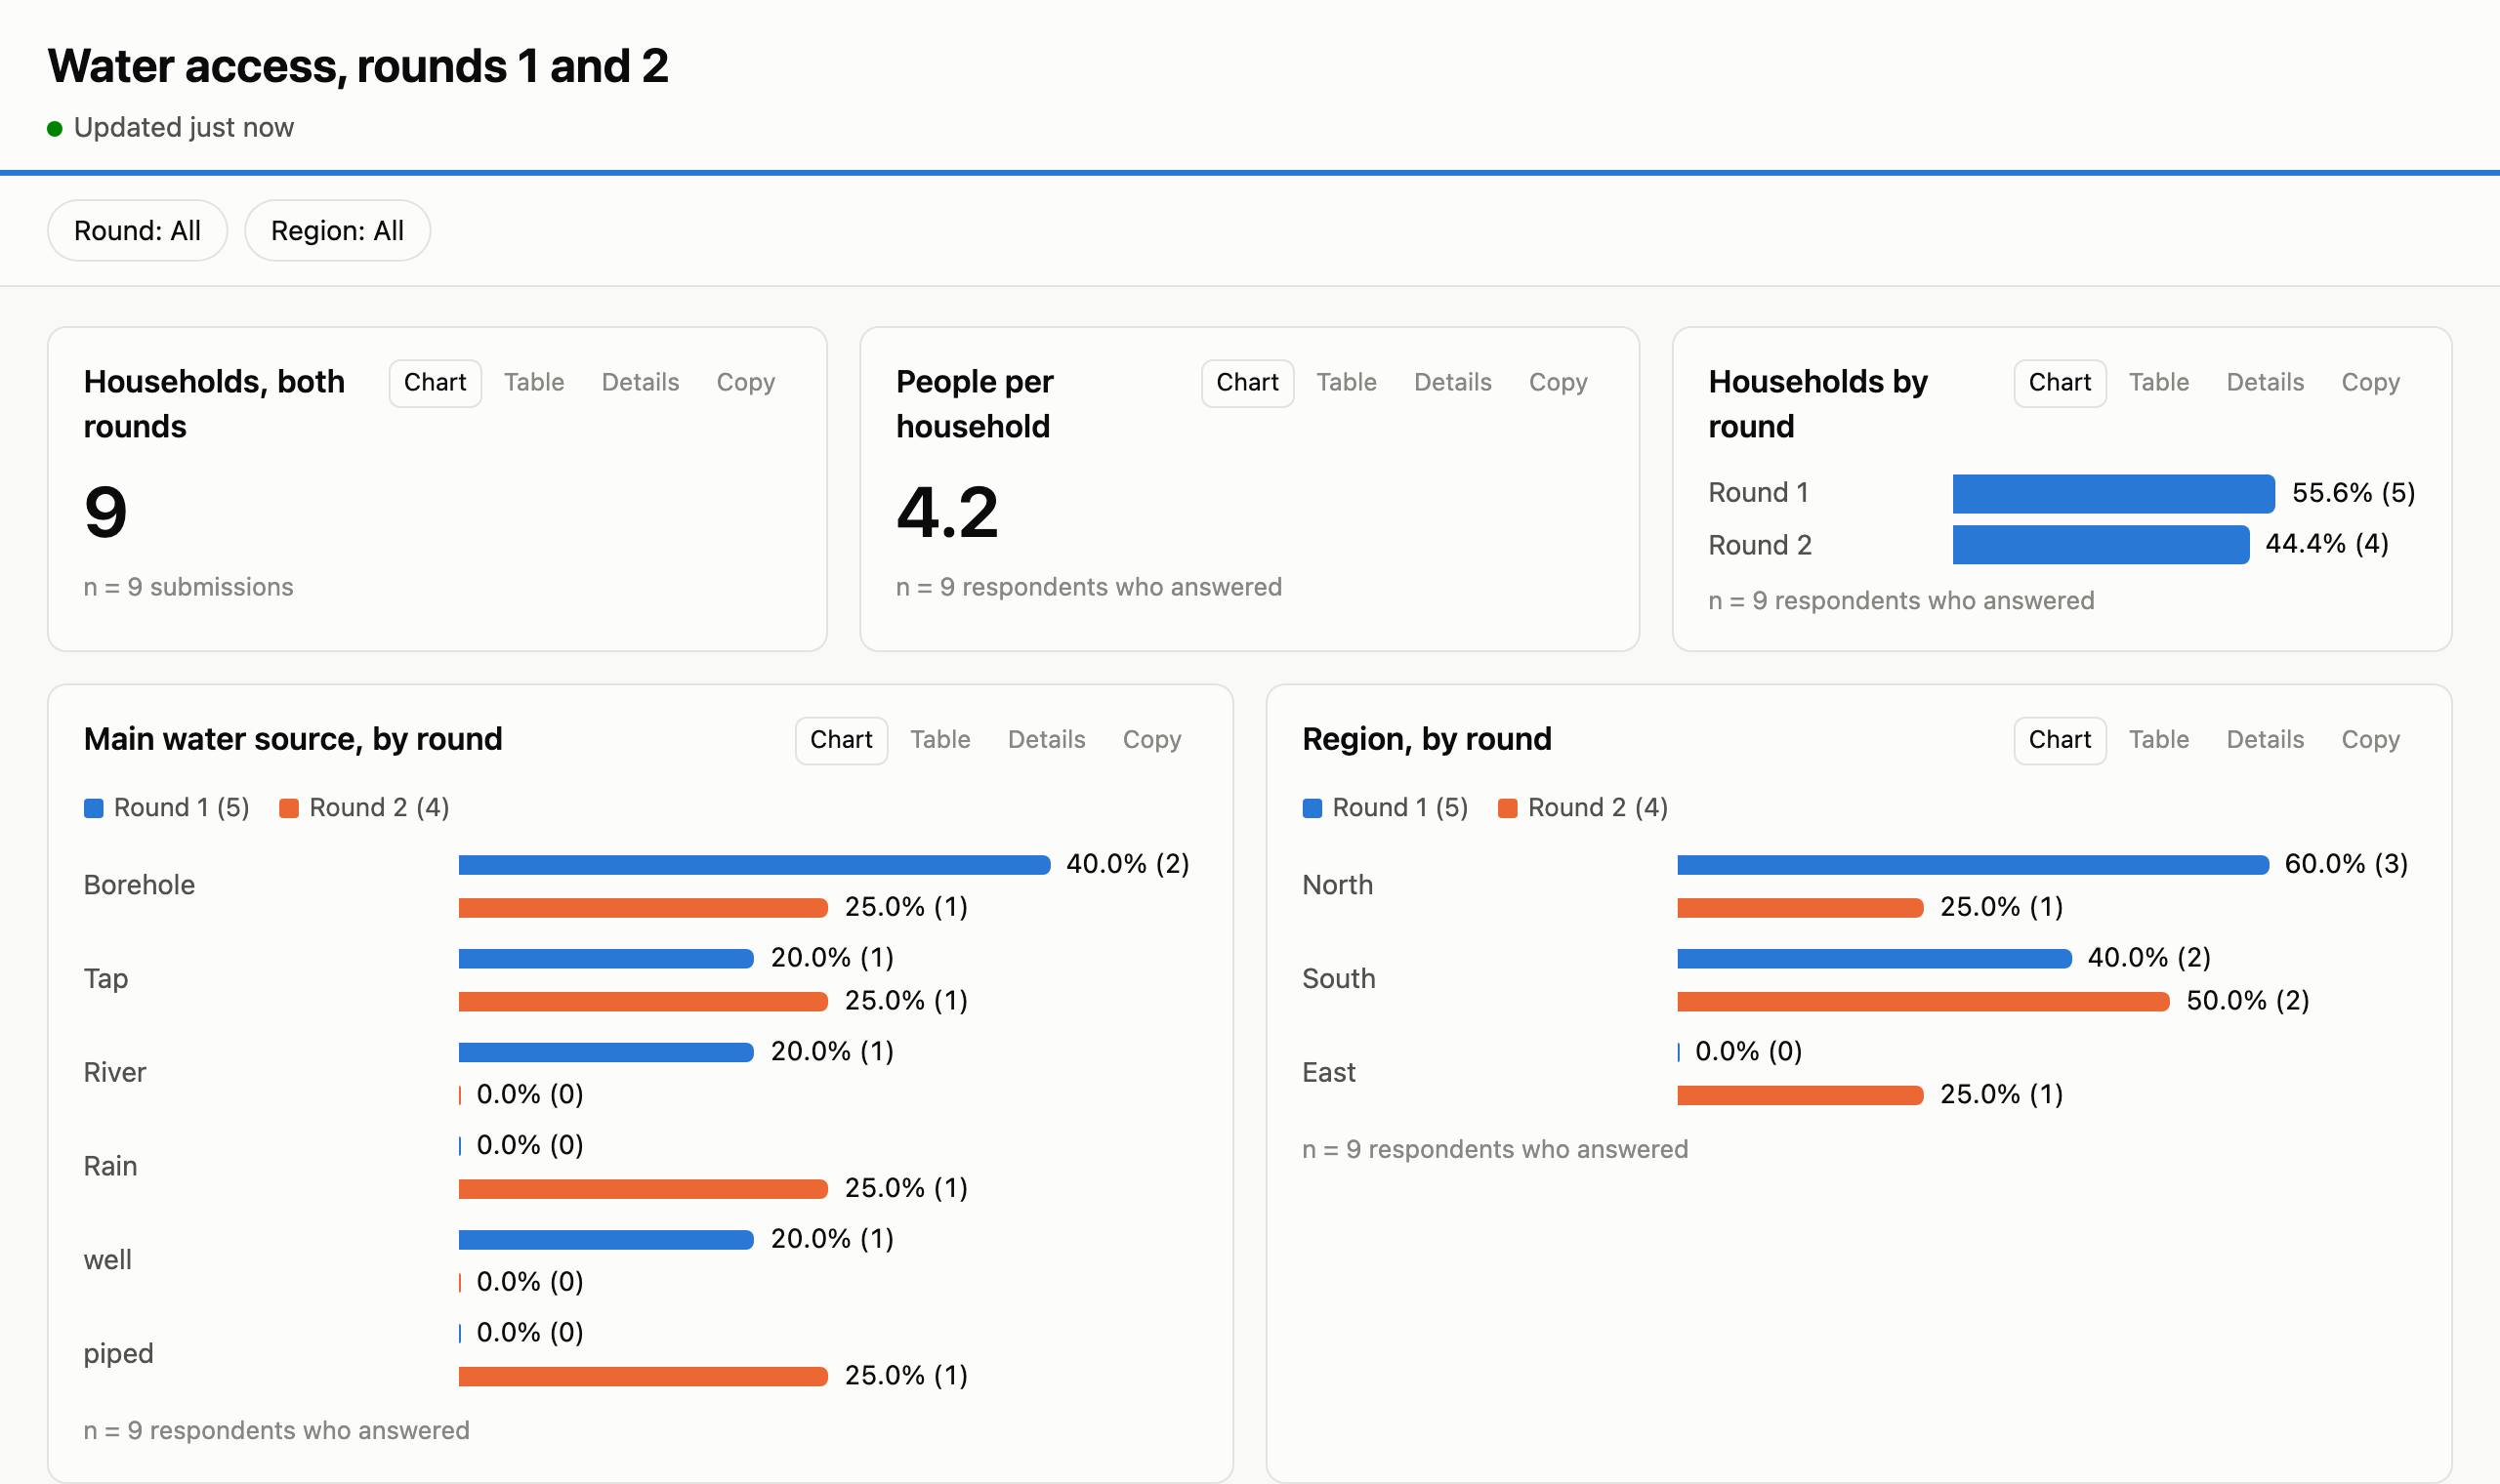
- Rounds of a survey are appended into one dataset, each row marked with its round, so a chart can compare round 1 with round 2. Questions renamed between rounds are matched up, and choices coded differently are recoded to one code.
- Linked records: a household's registration, its survey and its follow-up visits can be joined on the household's id, even when the id is typed differently in each (
HH-01,hh01). A repeat group, such as the members of a household, can be counted per household (its size, its children under 5) or charted on its own. - Cleaning is done in steps the assistant writes and you can read: rename, recode, convert to numbers or dates, fill one question from another, tidy ids, leave out test submissions, keep the latest visit of each household.
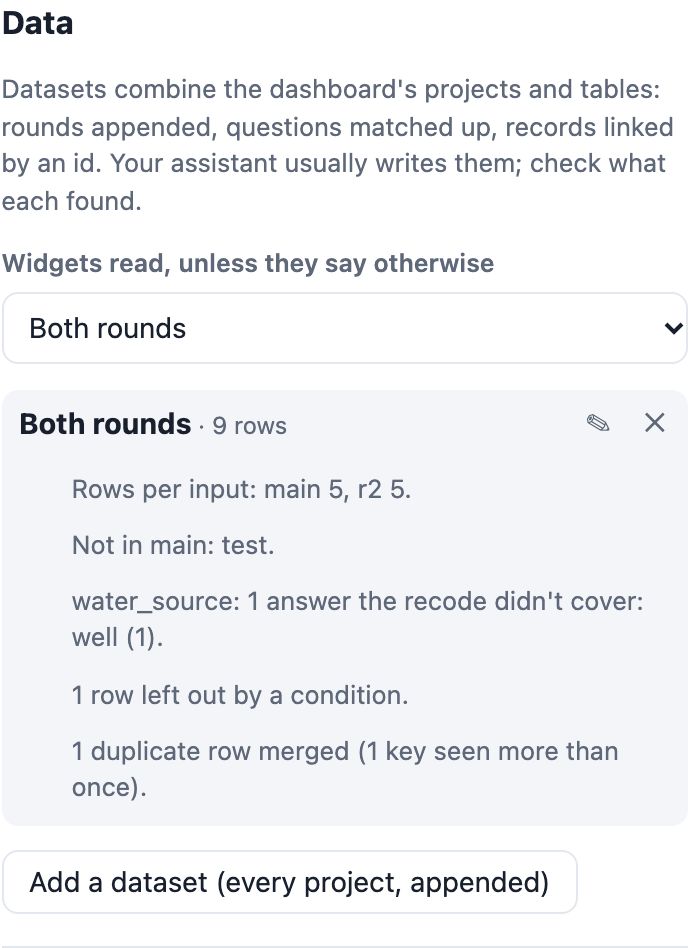
- Before saving, the assistant tells you what it found: how many rows each round has, which codes didn't match, how many ids weren't found on the other side (with a few of them). It asks you when two questions could be the same, and never guesses which field links the projects.
- Tables, under Tables on the admin home page: upload a CSV file (UTF-8, with a header row; a KoboToolbox export works). Each column's kind is worked out, and you can correct it. Uploading again with the same key replaces the rows, and dashboards using the table update. The assistant can also store a small table it wrote, such as targets per district; lists of people are better uploaded, so they don't pass through the chat.
- Check it in the dashboard's settings, under Data, or in the layout editor's Data panel: each combined dataset lists what it found in the data.
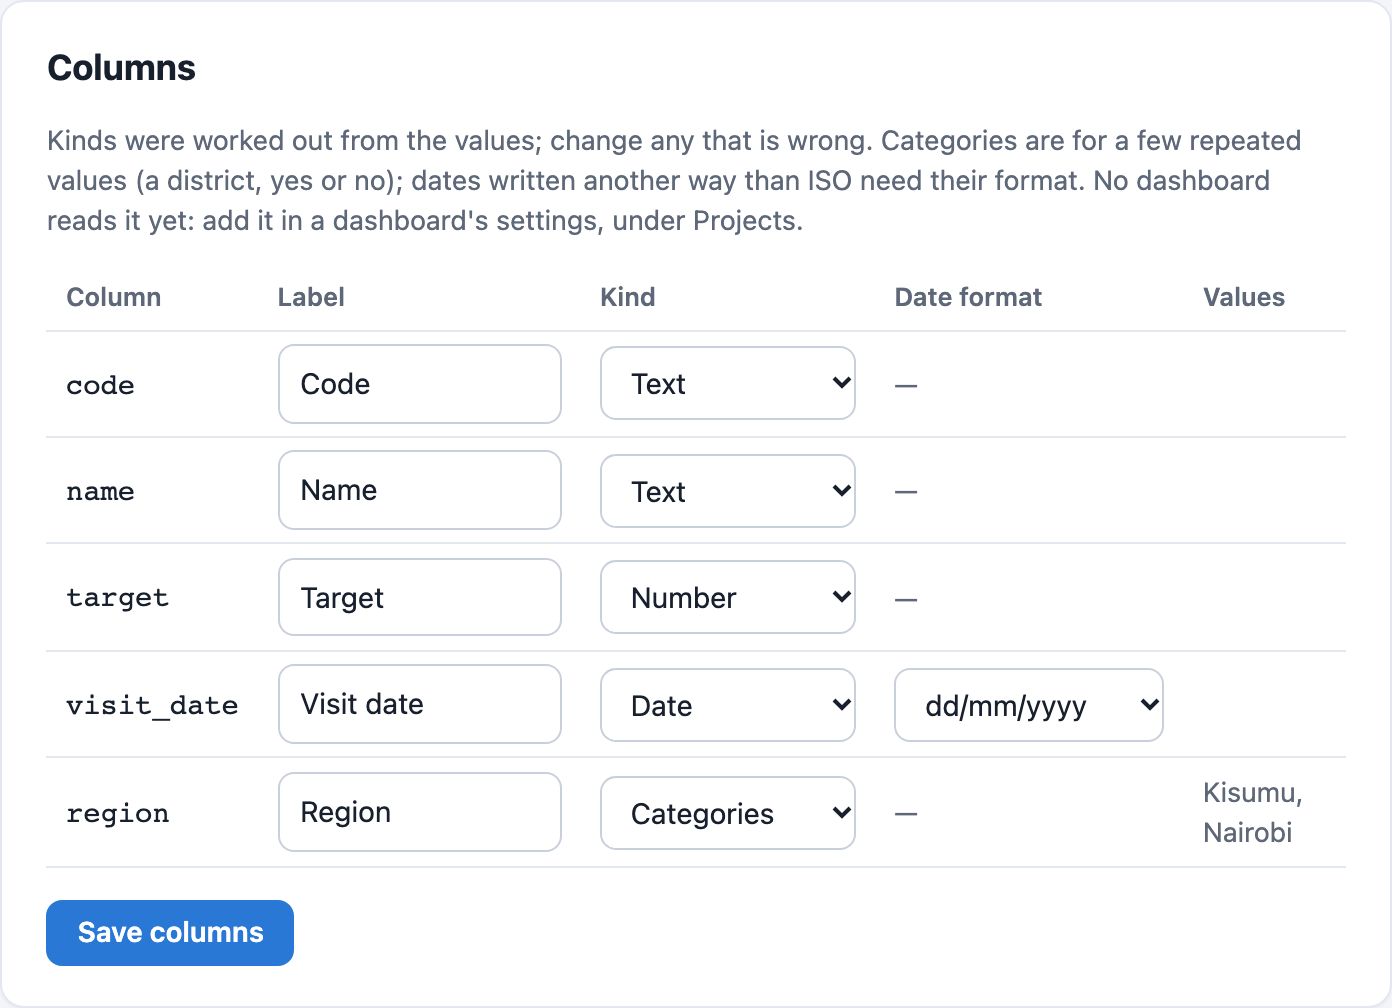
If you stop managing a project, the dashboard stops showing its data at the next check, and this site deletes its copy a week later.
Desk research and narratives
Your assistant can research other sources for a dashboard, set them beside the survey's numbers, and write text about both, with citations. It does the research with its own tools and model (web search, pages it opens, files you give it); this site stores what it finds, checks it, and shows it. The Desk review for a dashboard prompt in your client walks it through.
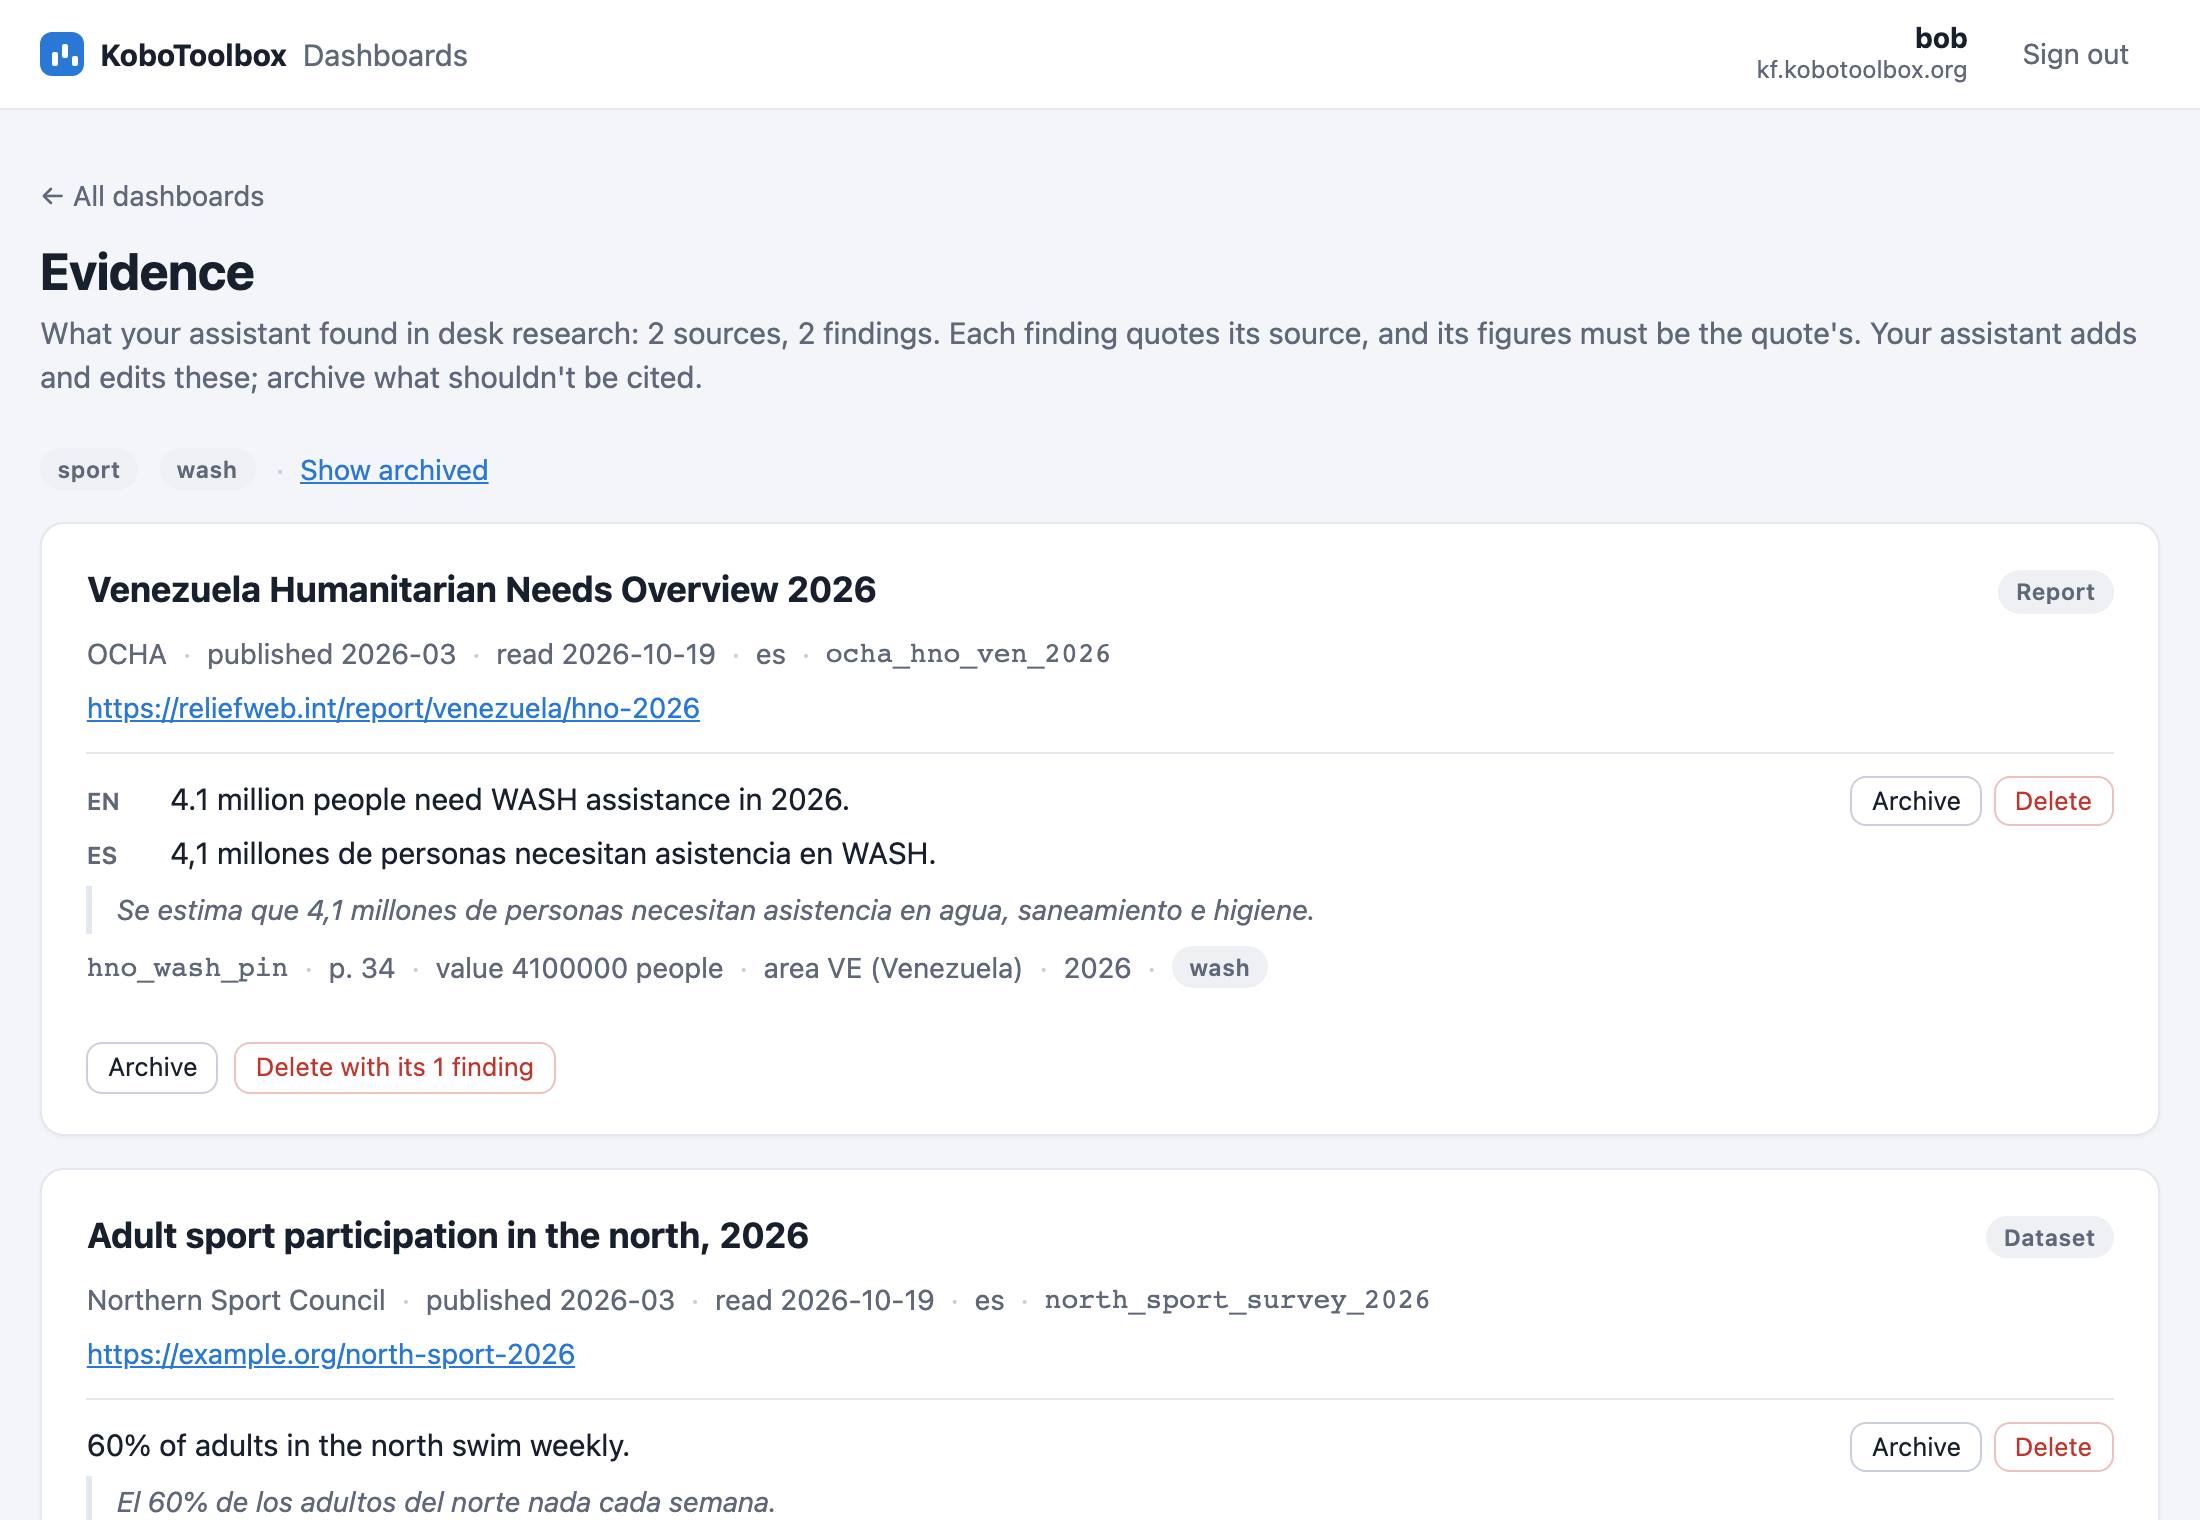
- Your evidence library. Each source (the organisation, title, link and the date it was read) and the findings taken from it: a claim, the passage it quotes word for word, and where in the document. Every figure in a claim must be a figure in its quote, so a rounded or invented number is refused, in any language (“4,1 millones” backs “4.1 million”). Check and archive them on the admin page's Evidence page.
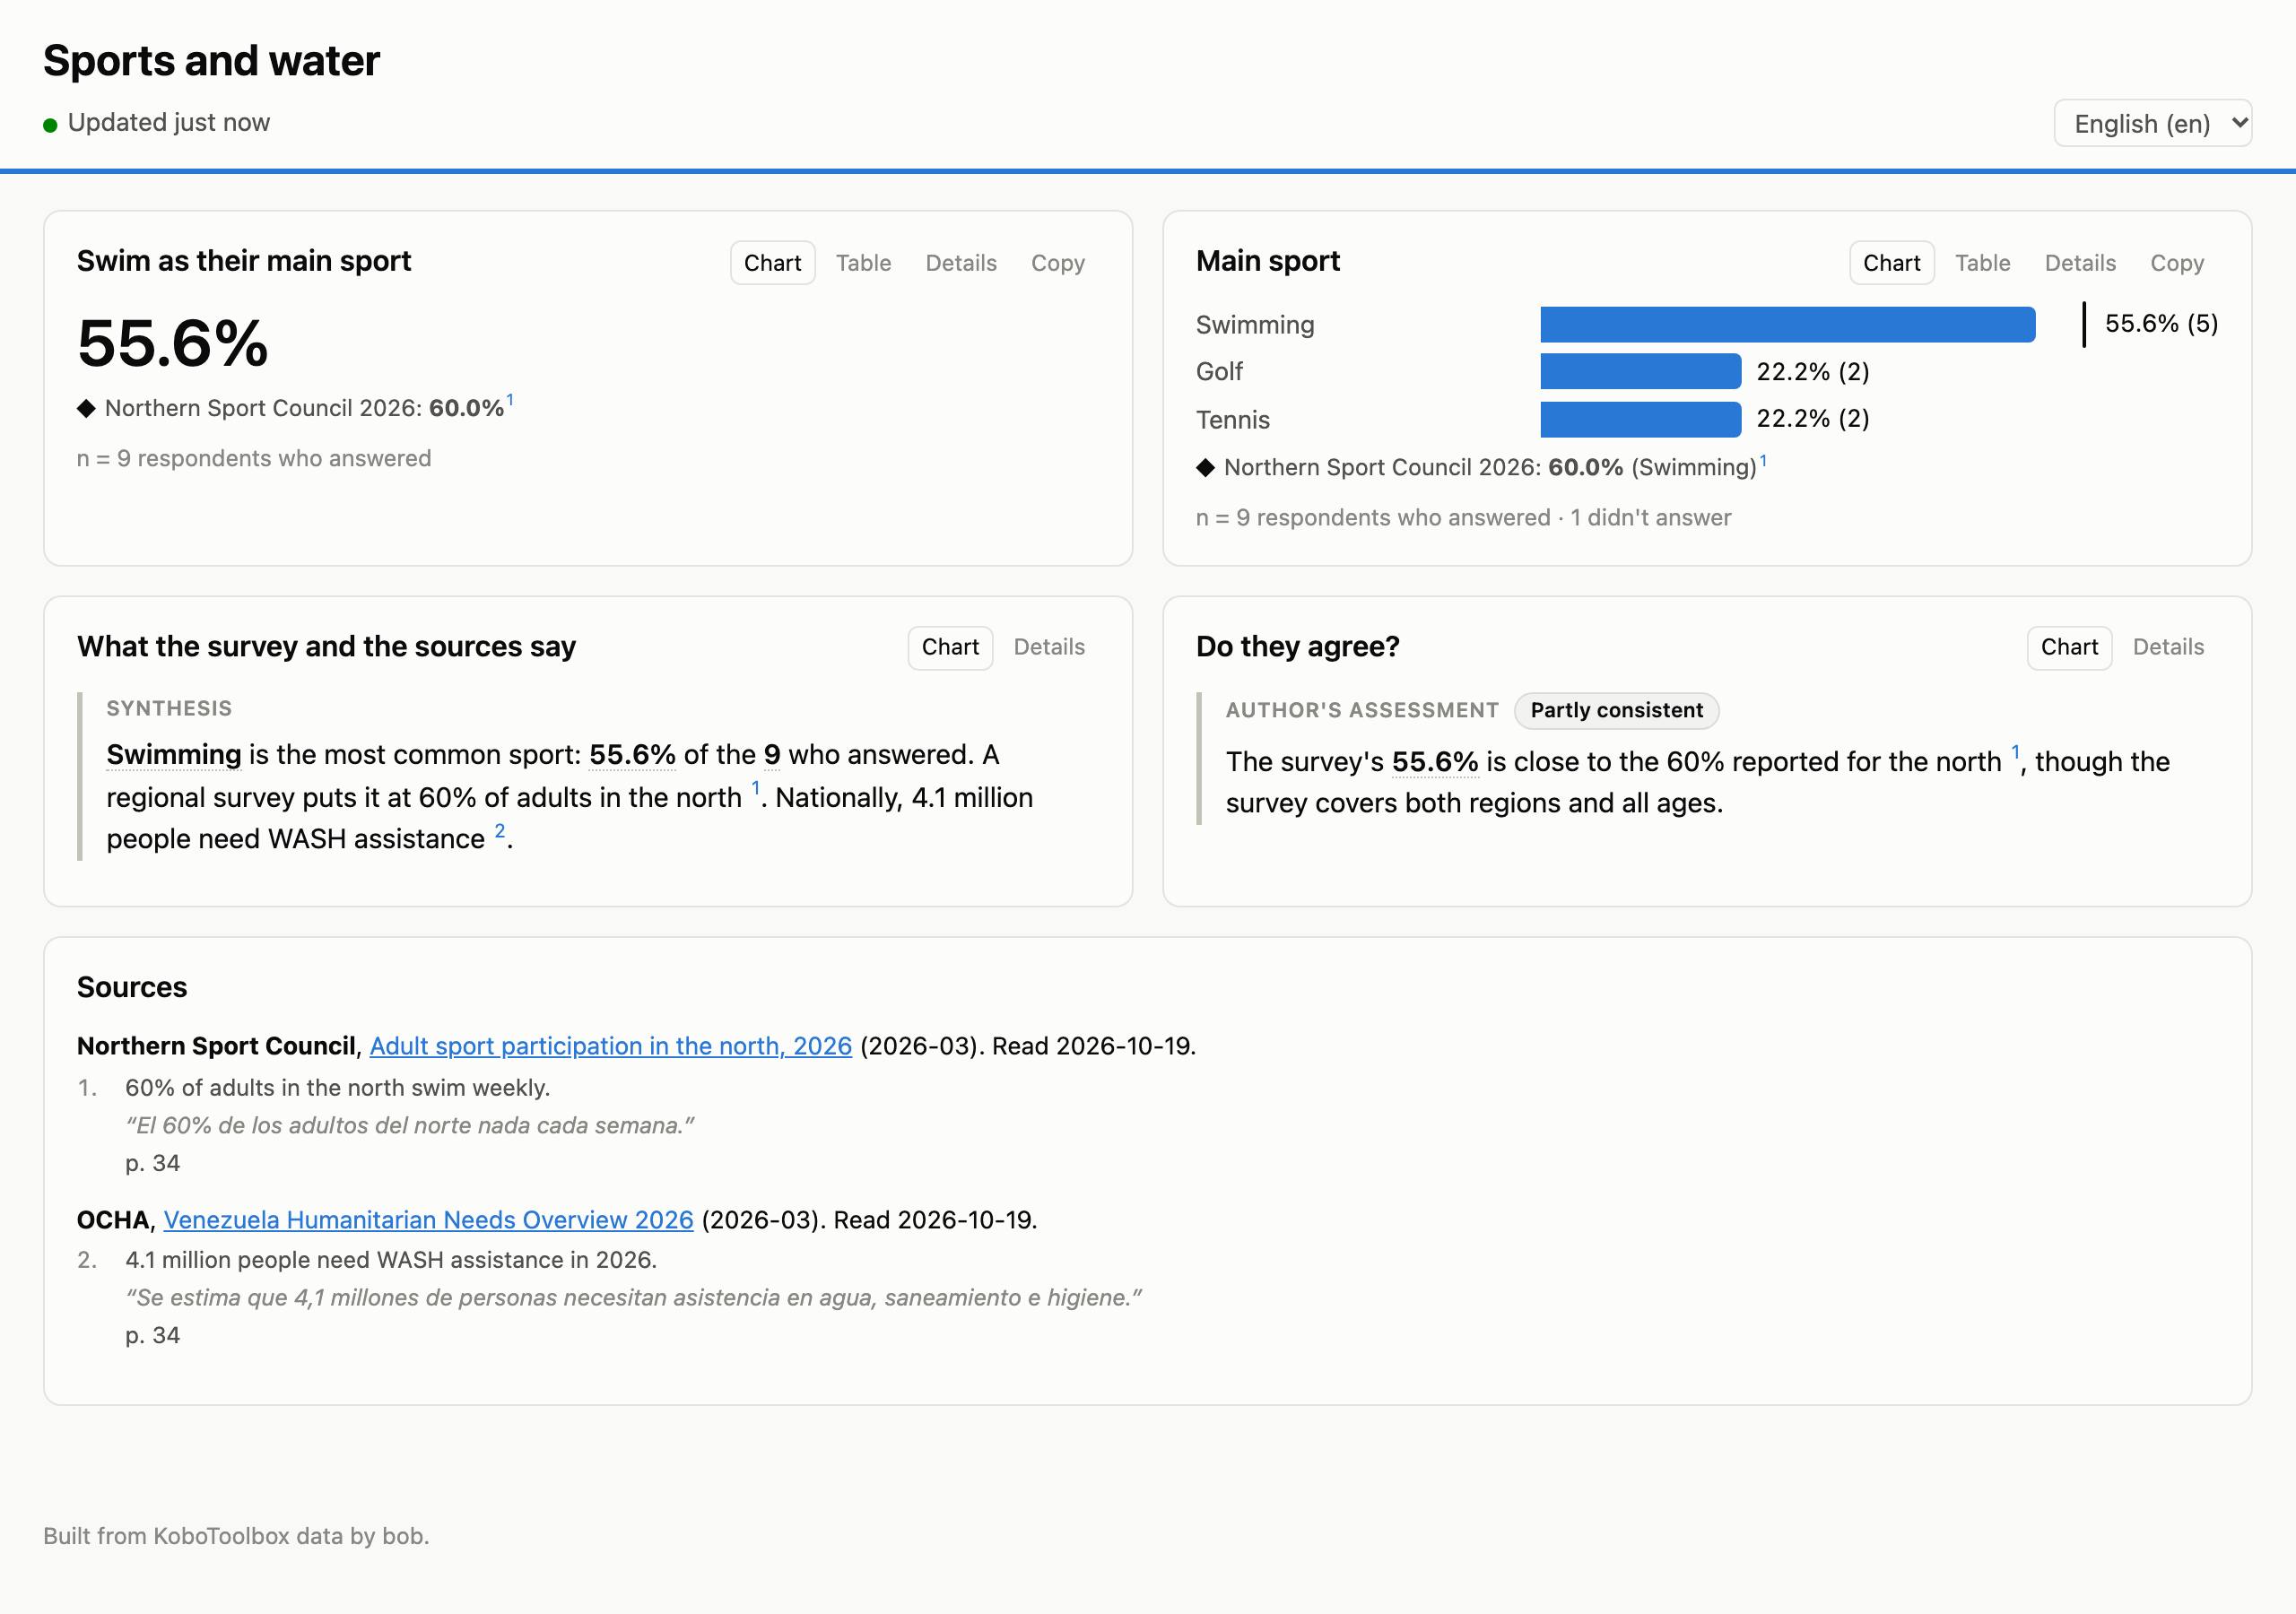
- Narratives. The survey's numbers in the text are placeholders filled from the live data, over all responses. A source's figures appear only with a citation, numbered, with the source, its quote and a link under the text or in a Sources block. Any other number is flagged before it can be published. A text can be about the survey, about the sources, both, or the author's own assessment of how they compare, with a verdict you choose.
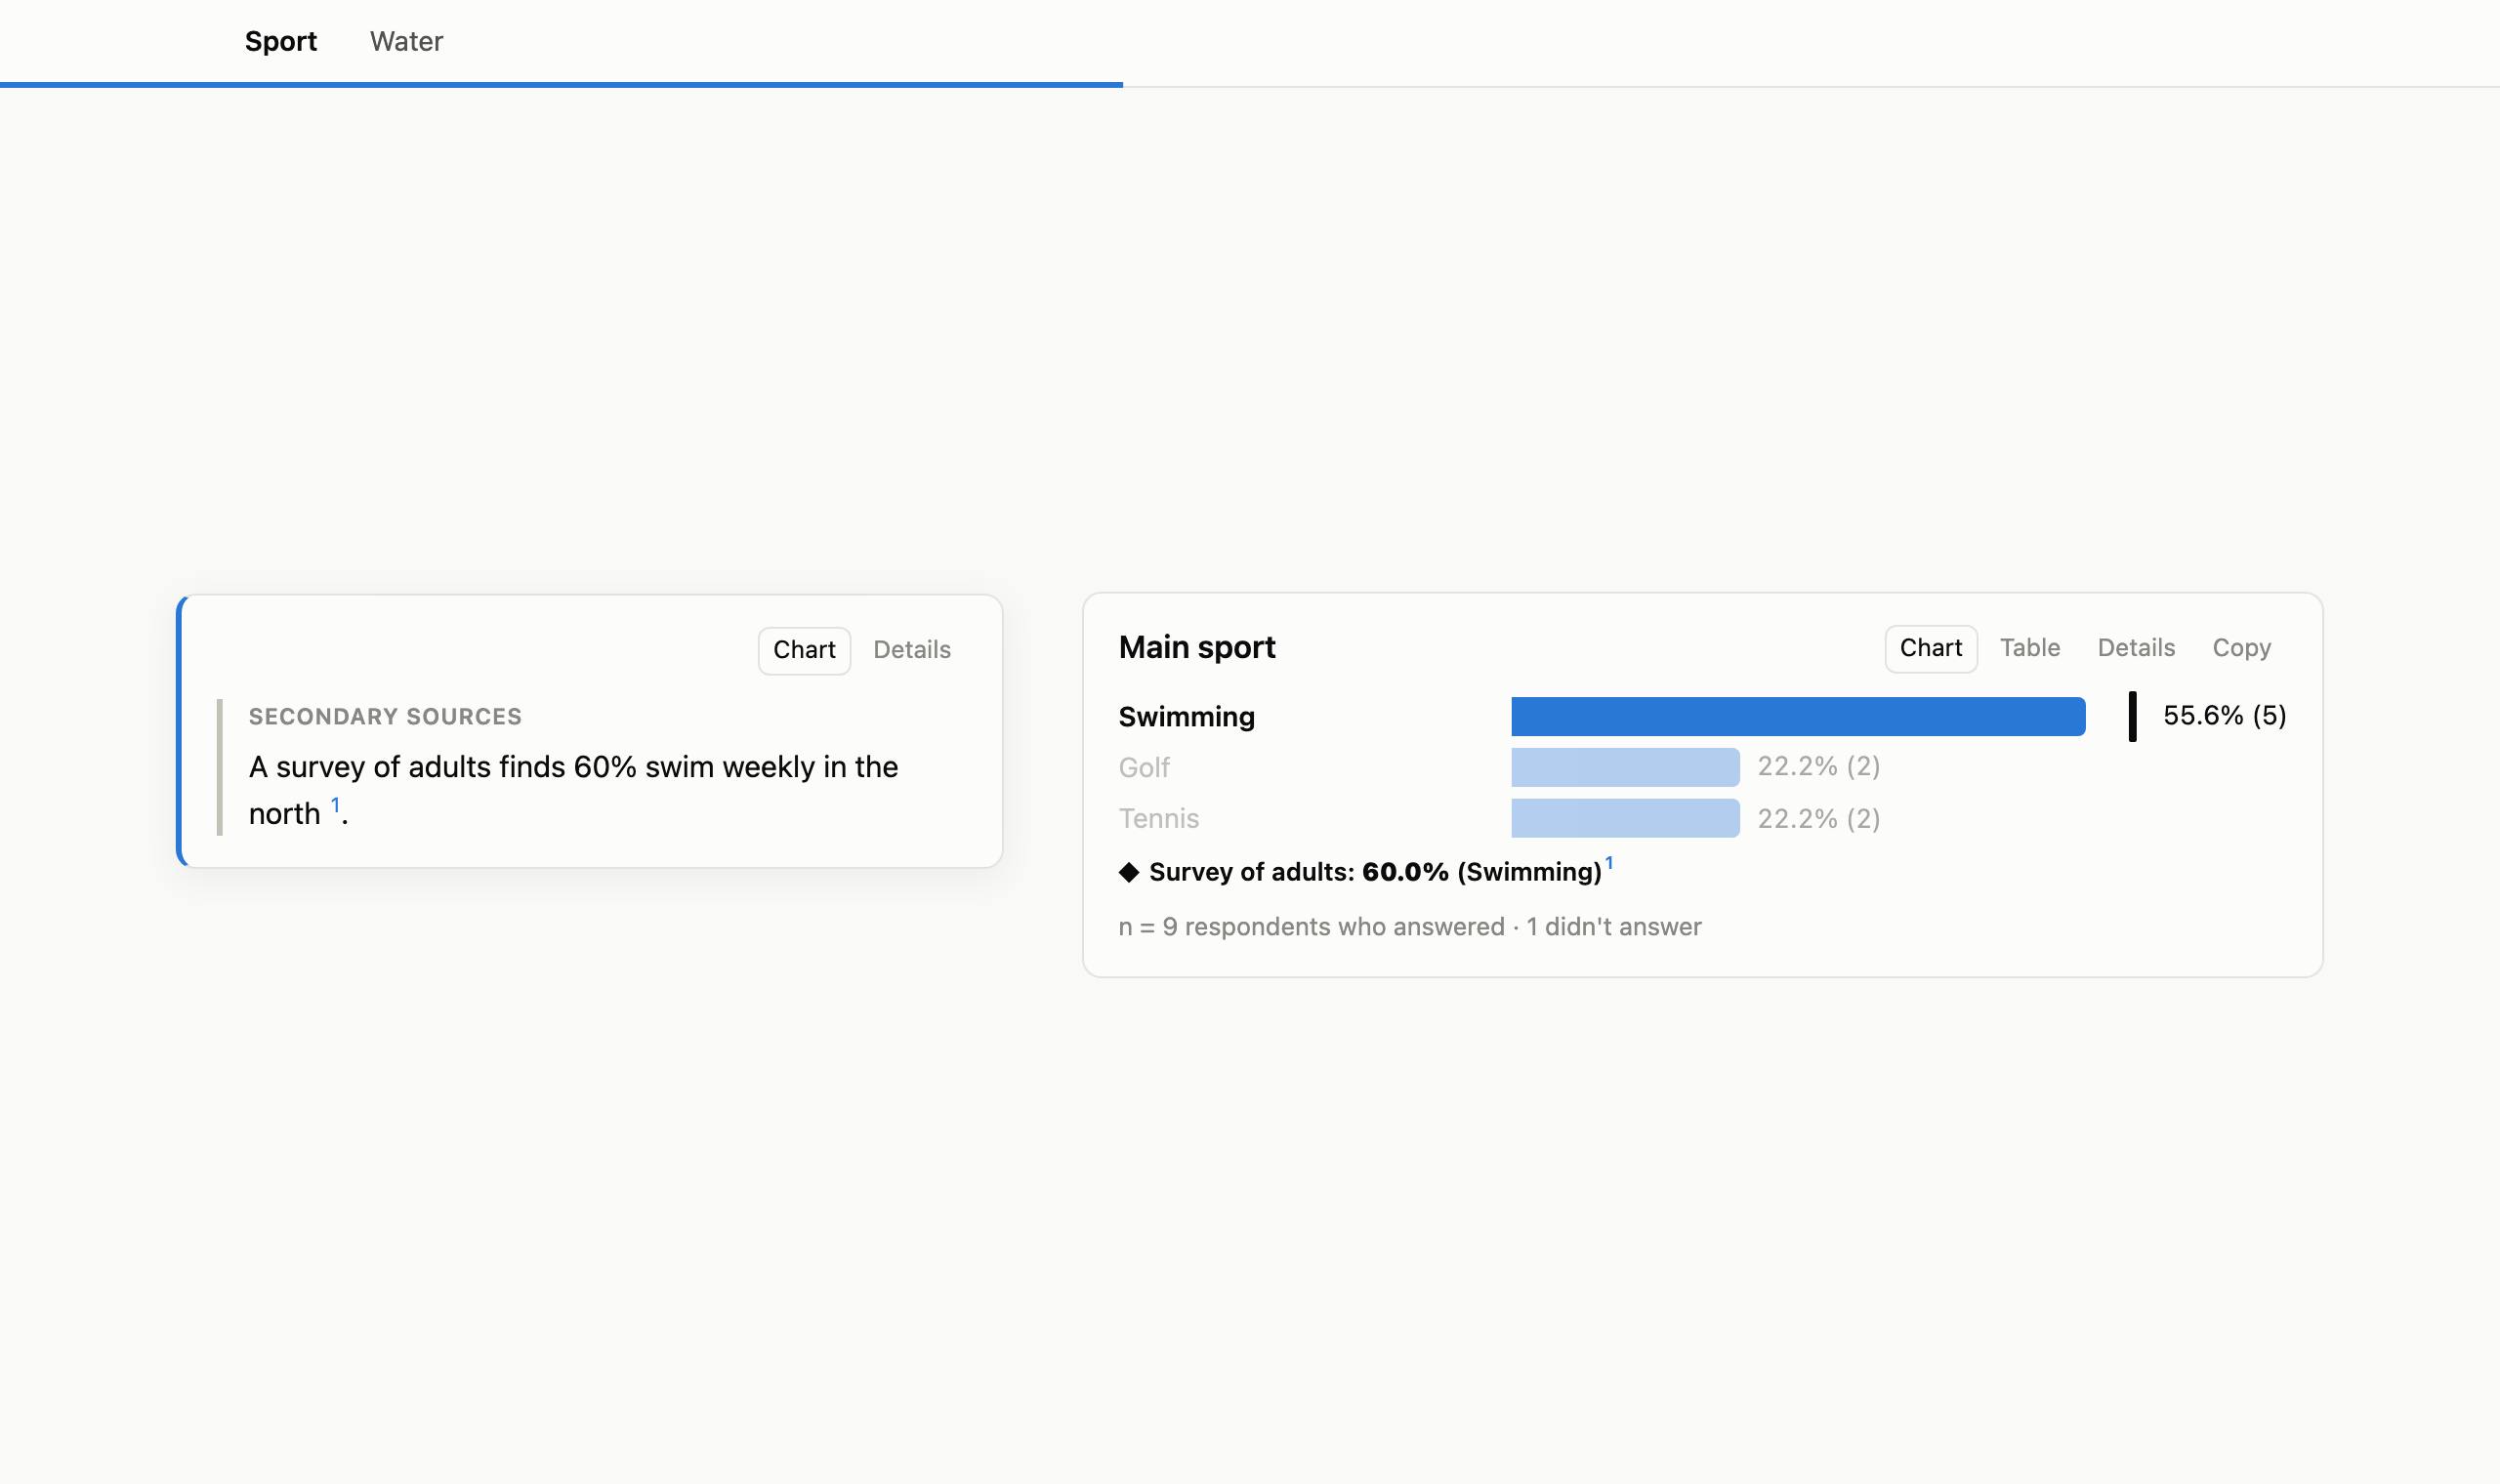
- Side by side on charts. A source's figure can sit beside a number, a bar (as a tick at its share), a tile, or an area's tooltip on a map, with its citation. The dashboard compares like with like and never judges whether they agree.
- Drafts, then publishing. Viewers see a text only once it is published. The assistant shows you how it reads, sources included, and publishes when you say so; or publish it yourself in the dashboard's settings. Viewers keep that text, its numbers up to date, until it is published again or withdrawn.
- When the data moves. If new submissions move its numbers (a share by 5 points, another number by 20%), or a source it cites is edited, the text is flagged for review. Viewers see when it was written and how many responses there were then, or, if you choose, don't see it until you've read it again.
Each widget's numbers come from its own dataset when a dashboard combines projects (see Combining projects), and so do the placeholders that name it.
Layout editor
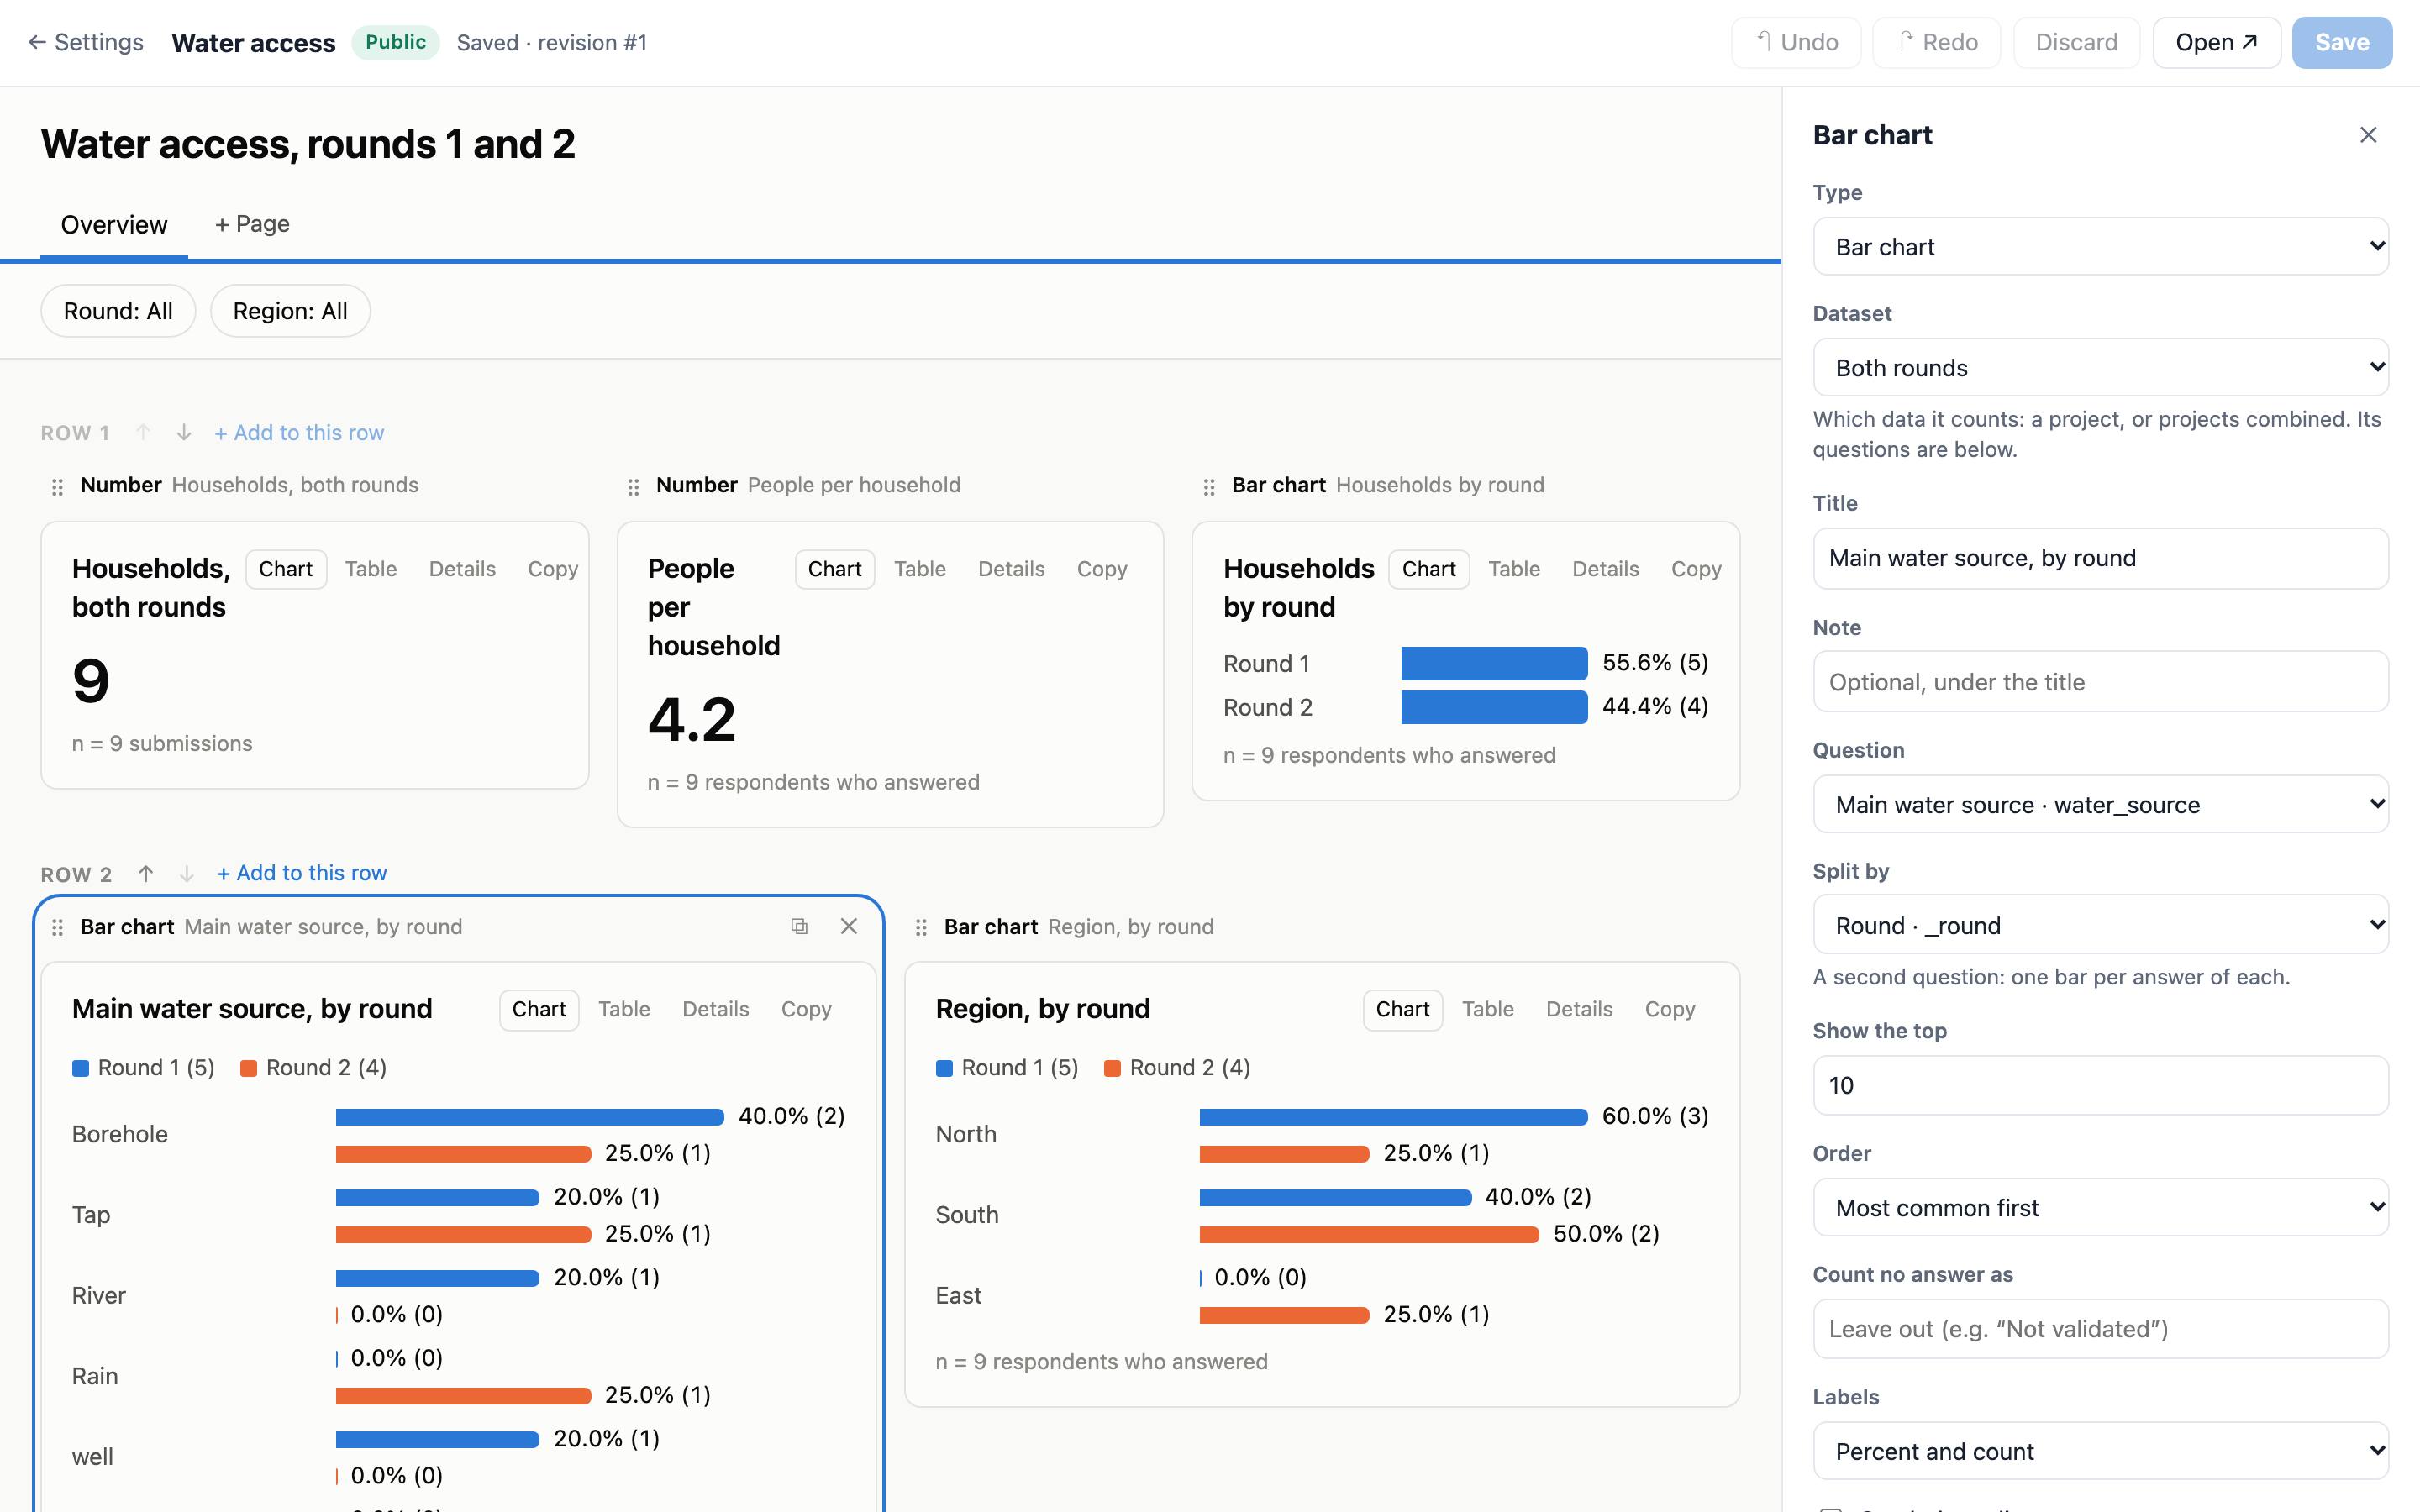
Open Edit layout on a dashboard. You see the dashboard as viewers will, with its real numbers worked out from your unsaved changes, even while it's offline.
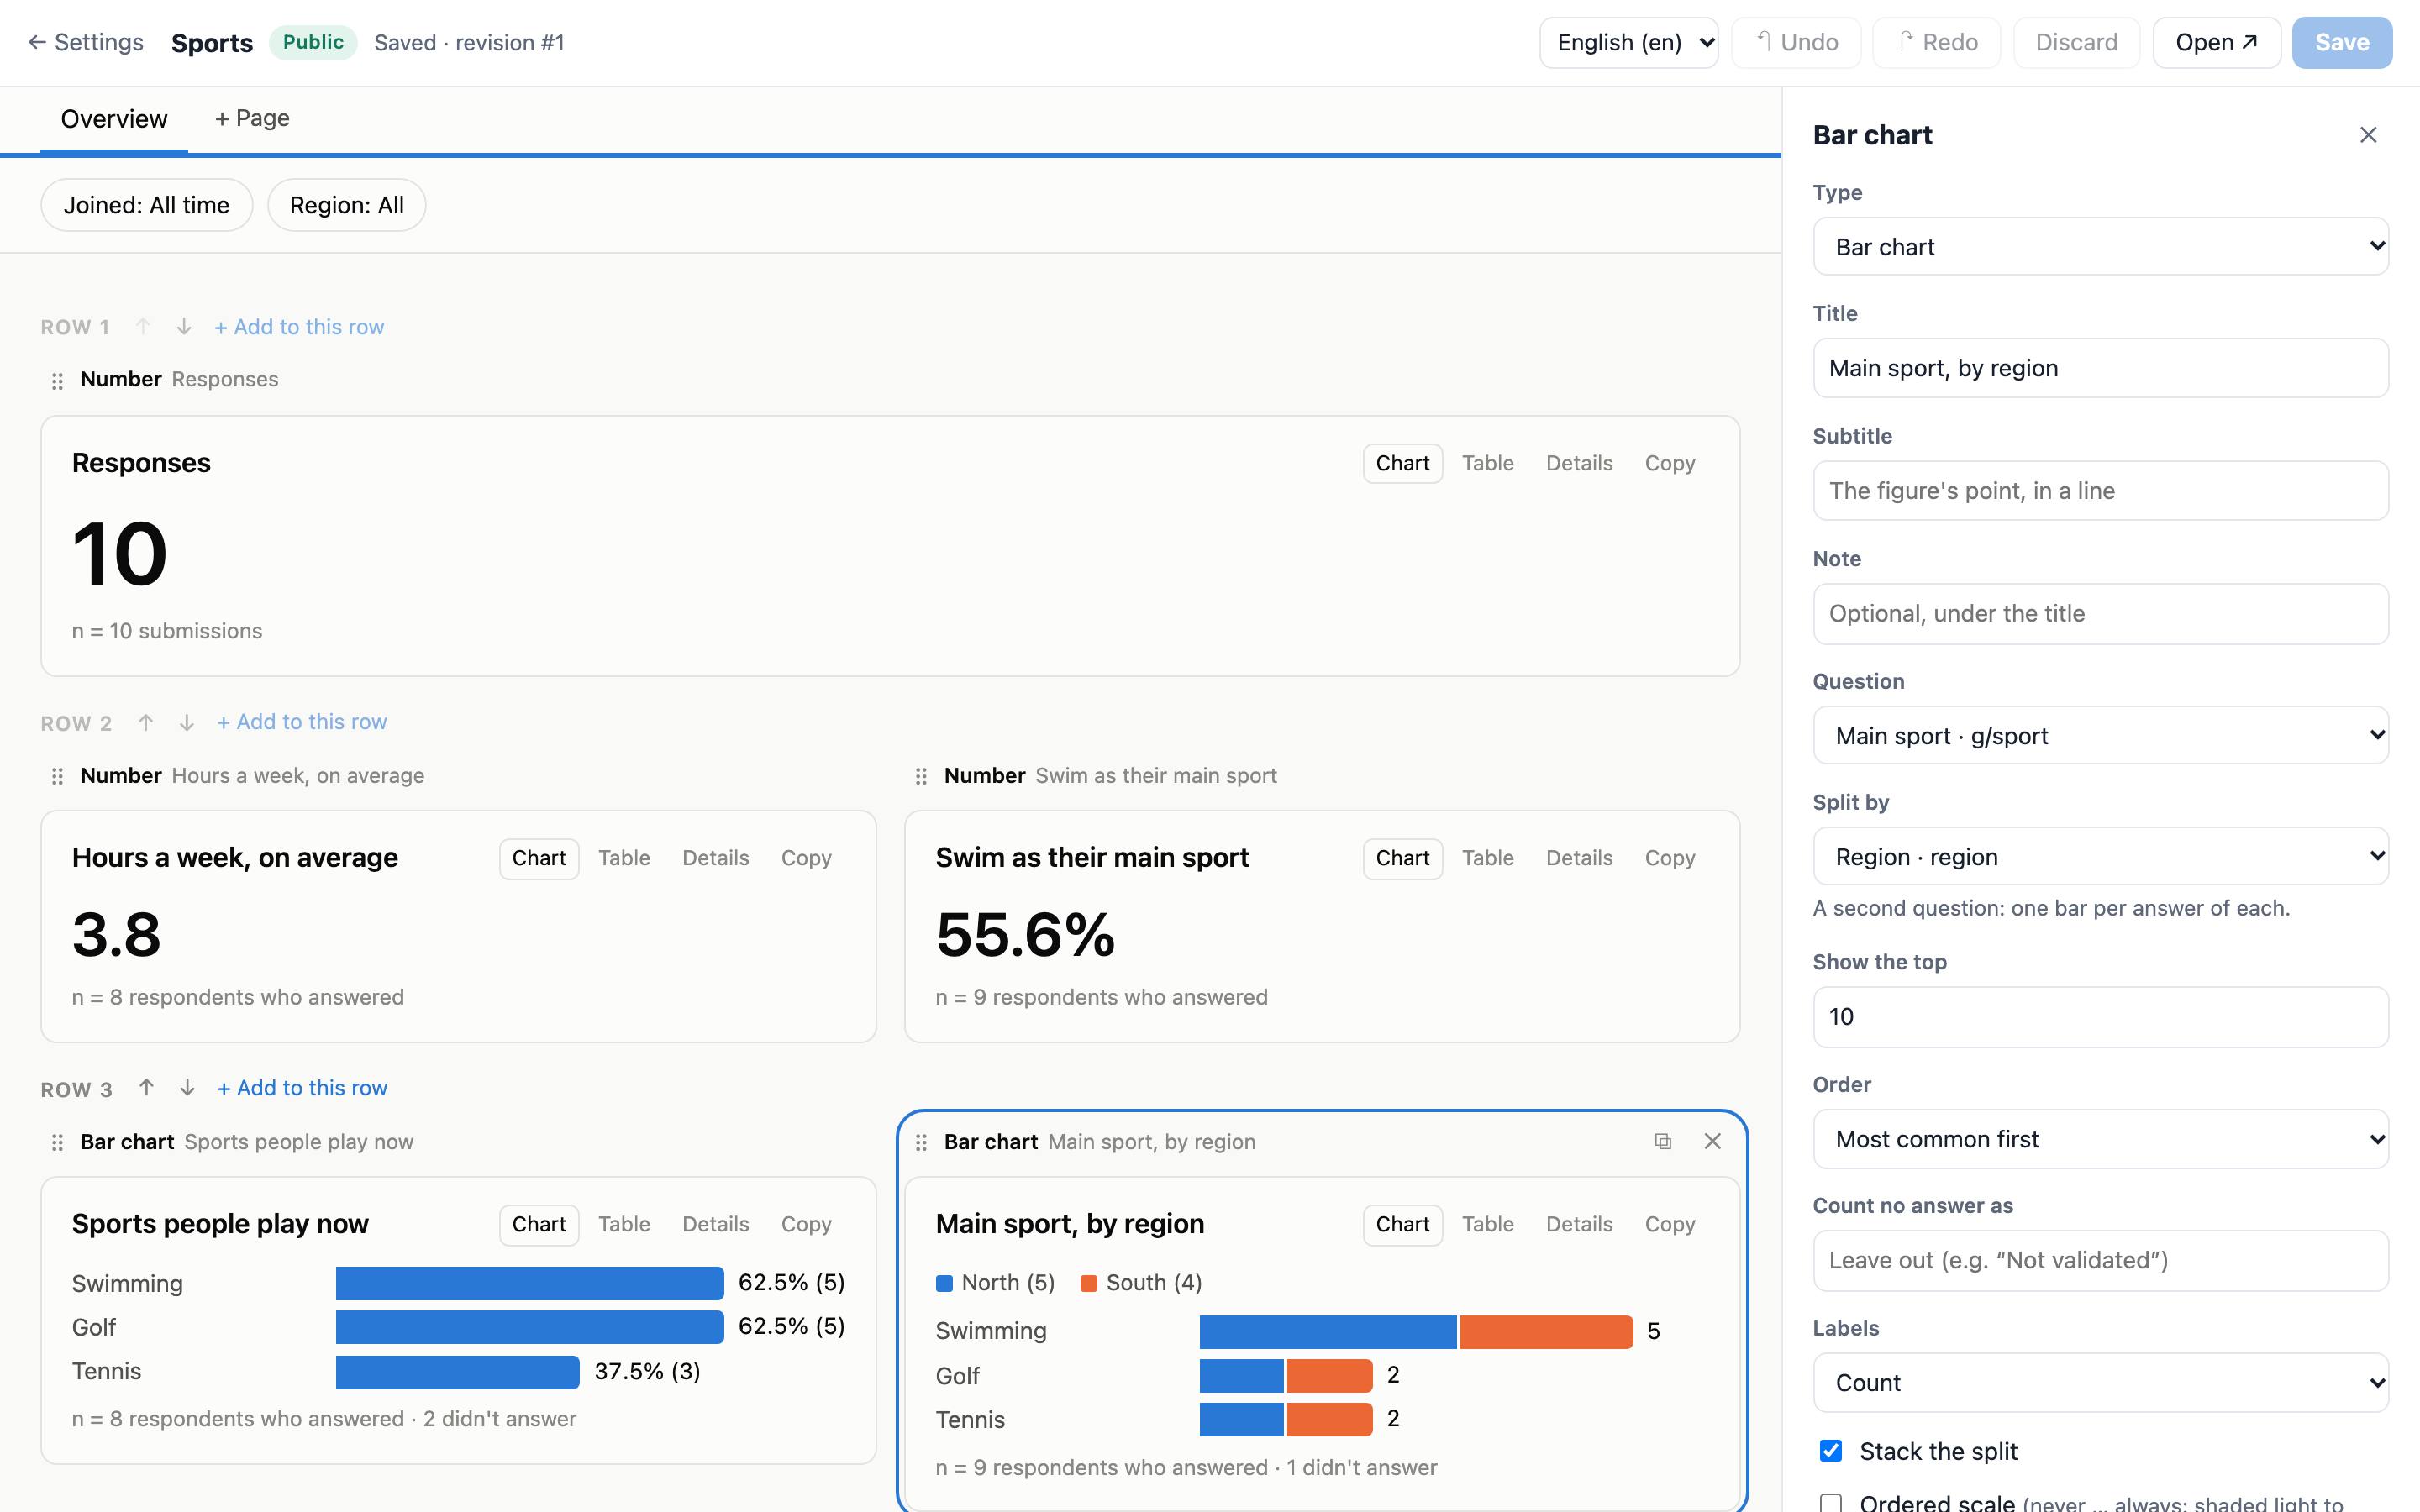
- Move a widget by dragging its handle beside another, or between rows for a row of its own. Up to 6 widgets share a row; rows move up and down.
- Add, duplicate, delete widgets, or change one's type, keeping what still fits. The panel offers the questions that fit each widget.
- Tooltip, in a chart's panel: its usual line or chosen rows, extra values, a caption, or none. Hover the chart to see it.
- Datasets: when the layout combines projects, a widget's panel has a Dataset choice, and its questions are that dataset's. The Data panel shows what each dataset found in the data, and its definition as JSON under Advanced.
- Pages, filters and calculated fields are in the panel when no widget is selected. Calculated fields start from templates: validation status, number bands, choices counted, interview length, the area of a location.
- Undo and redo while you work. Nothing changes for viewers until you Save, and each save can be undone from History.
- If your assistant changed the layout while you were editing, Save says so instead of overwriting its change.
Styles
Pick a style in a dashboard's settings, under Presentation and data. Every style except Standard uses KoboToolbox's brand colours and the Inter typeface:
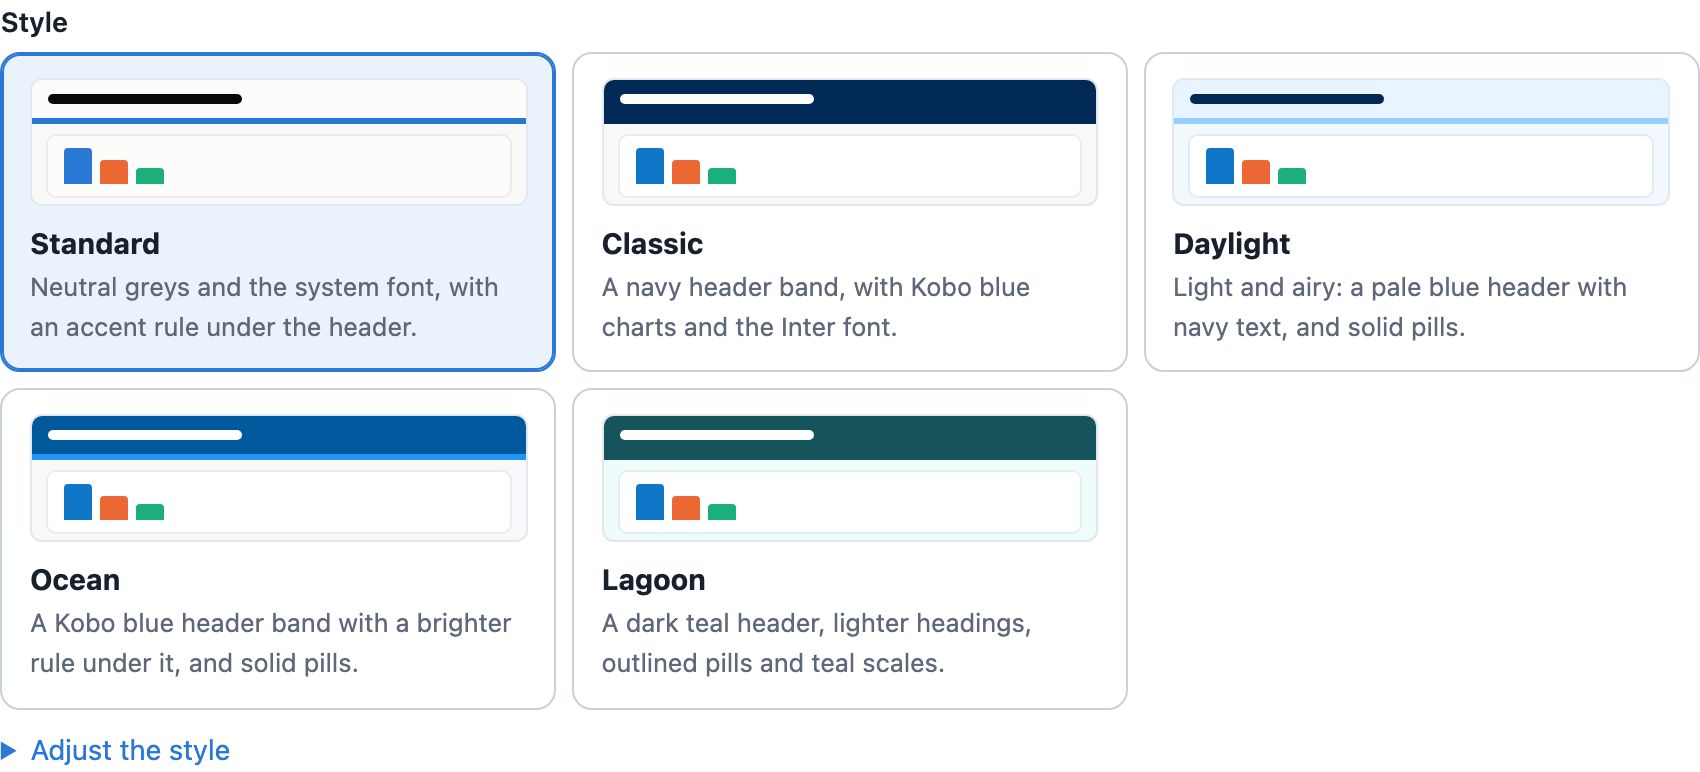
| Style | Looks like |
|---|---|
| Standard | Neutral greys and your device's font, with a coloured rule under the header. Dashboards made before styles came in keep this look. |
| Classic | A navy header band, with Kobo blue charts. |
| Daylight | A pale blue header with navy text, and solid filter chips and page tabs. |
| Ocean | A Kobo blue header band with a brighter rule under it, and solid chips and tabs. |
| Lagoon | A dark teal header, lighter headings, outlined chips and teal shading for ordered scales and area maps. |
- Light or dark: every style has both. Choose light with dark when the viewer's device is set to dark, always light, or always dark.
- Adjust the style changes one part and keeps the rest: the colours, the header (a rule or a coloured band), the type, the chips and tabs, or the first chart colour.
- Accent colour sets your own colour for the header and links, over the style's.
- The data's colours don't change meaning. A style colours the page around the charts and the first chart colour. Each answer keeps its colour from its place in the form. Every style is checked for readable text and for chart colours that people with colour blindness can tell apart, in light and in dark.
- A new style reaches open dashboards straight away, and History can undo it like a layout change. Your assistant can set it too.
Stories
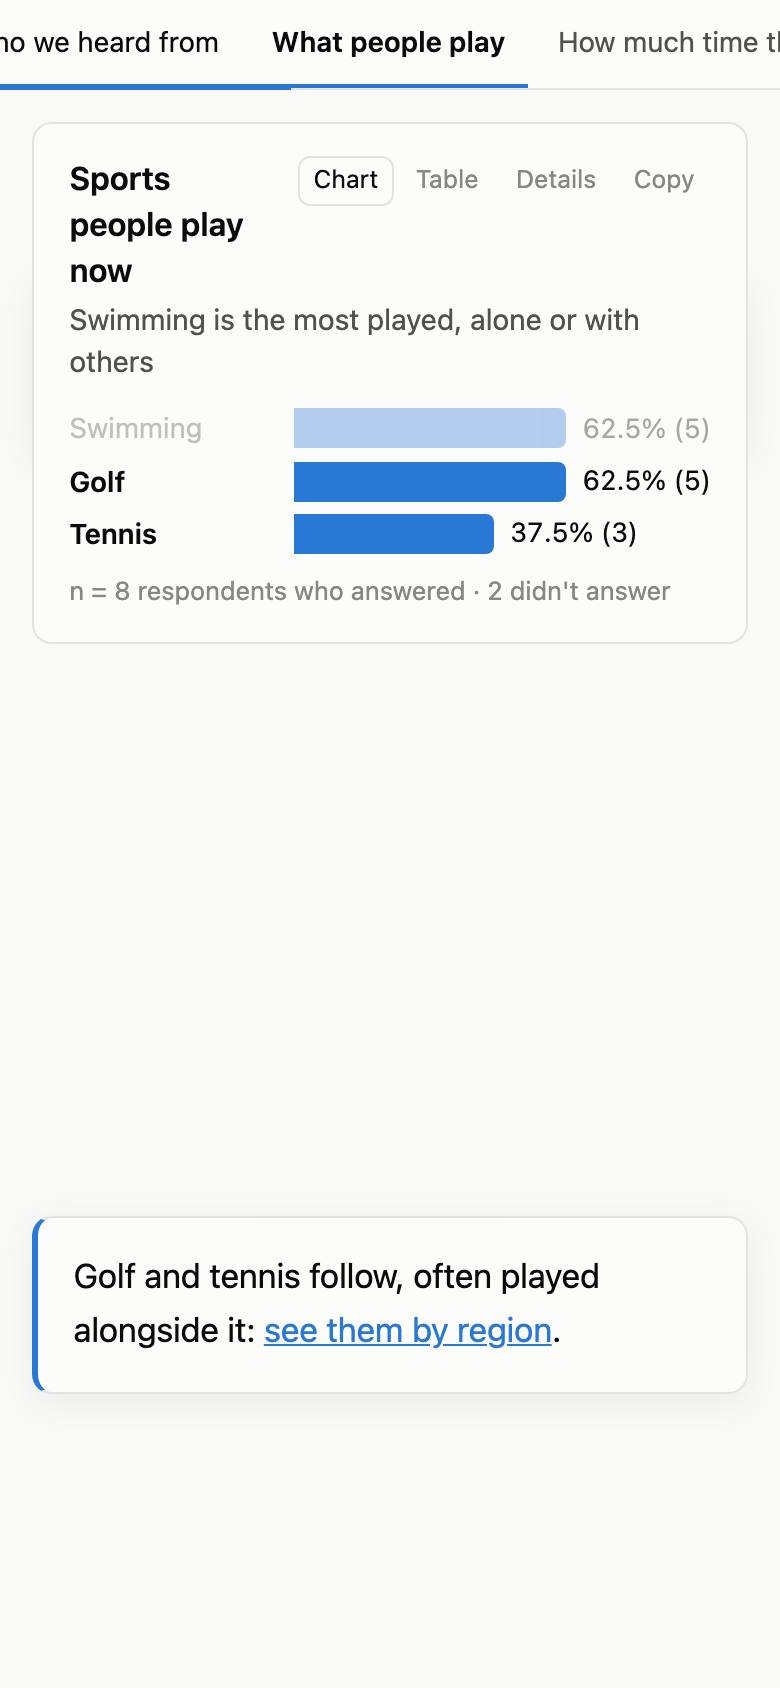
A dashboard can also read as a story: one scrolling page instead of tabs, like a news explainer or a story map. Its pages become chapters under a cover, and in a scrolly section a chart or map stays pinned while short passages of text scroll past it, each one changing what it shows. The numbers stay live.
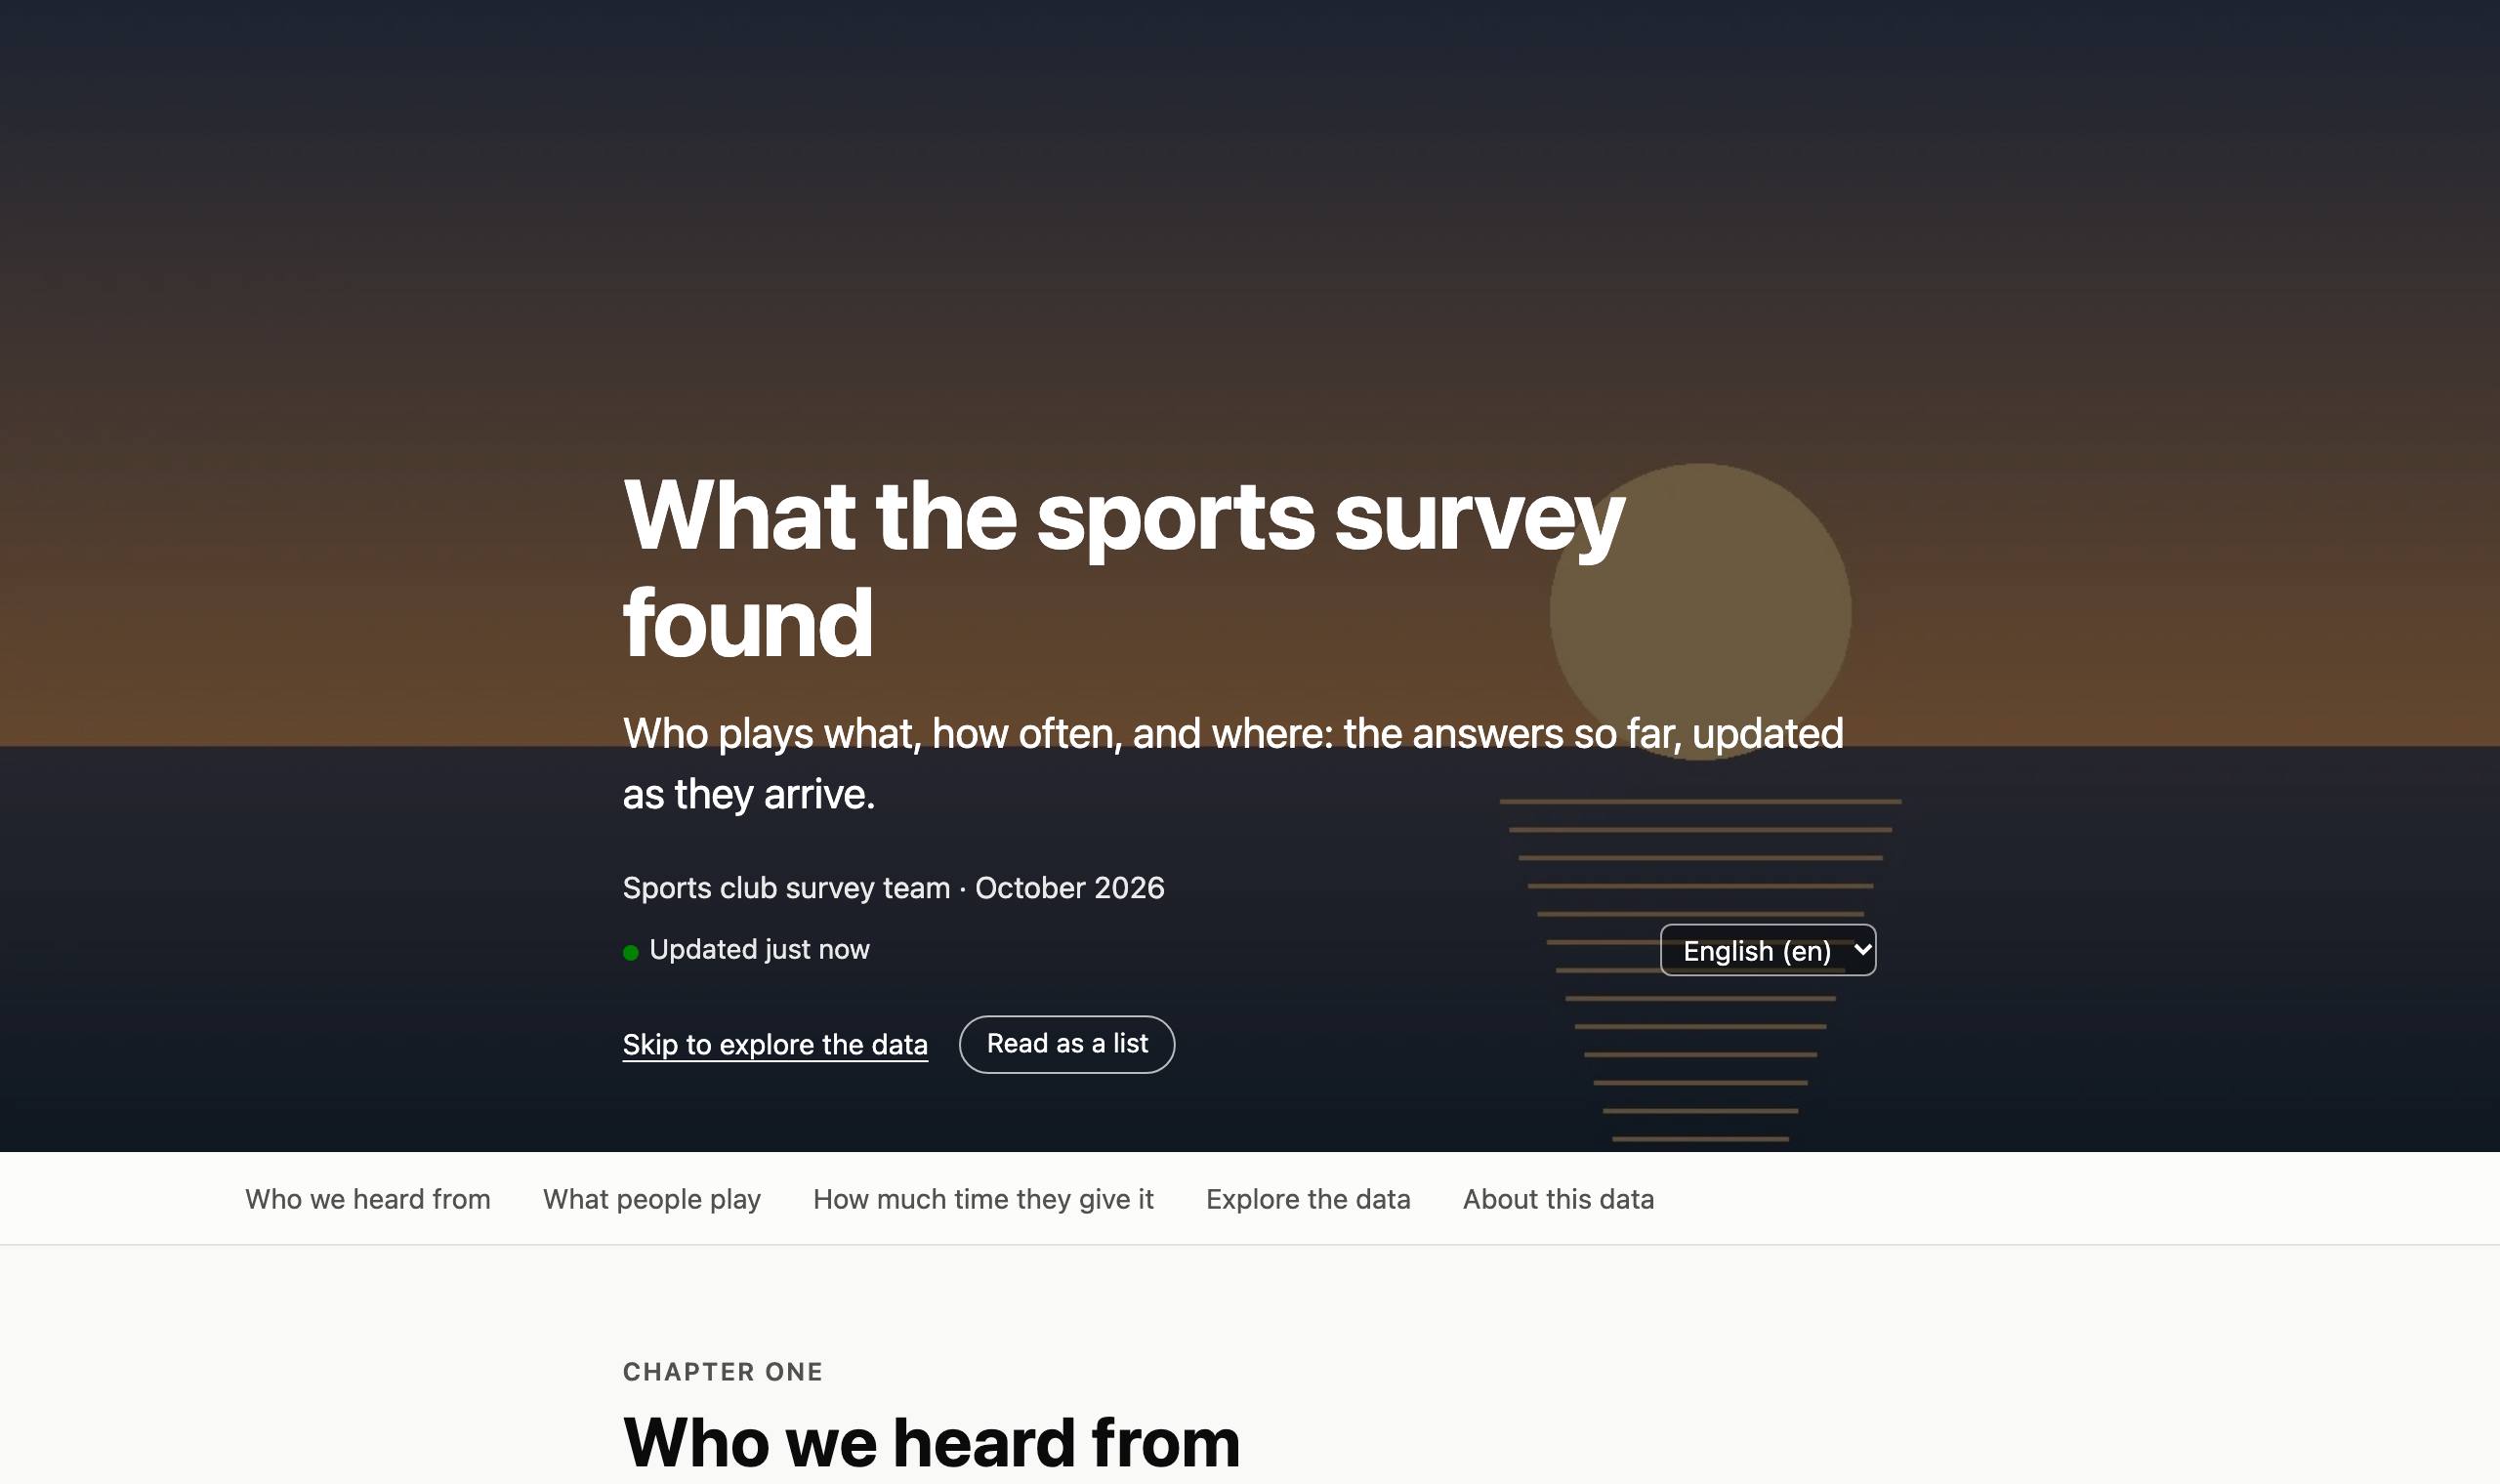
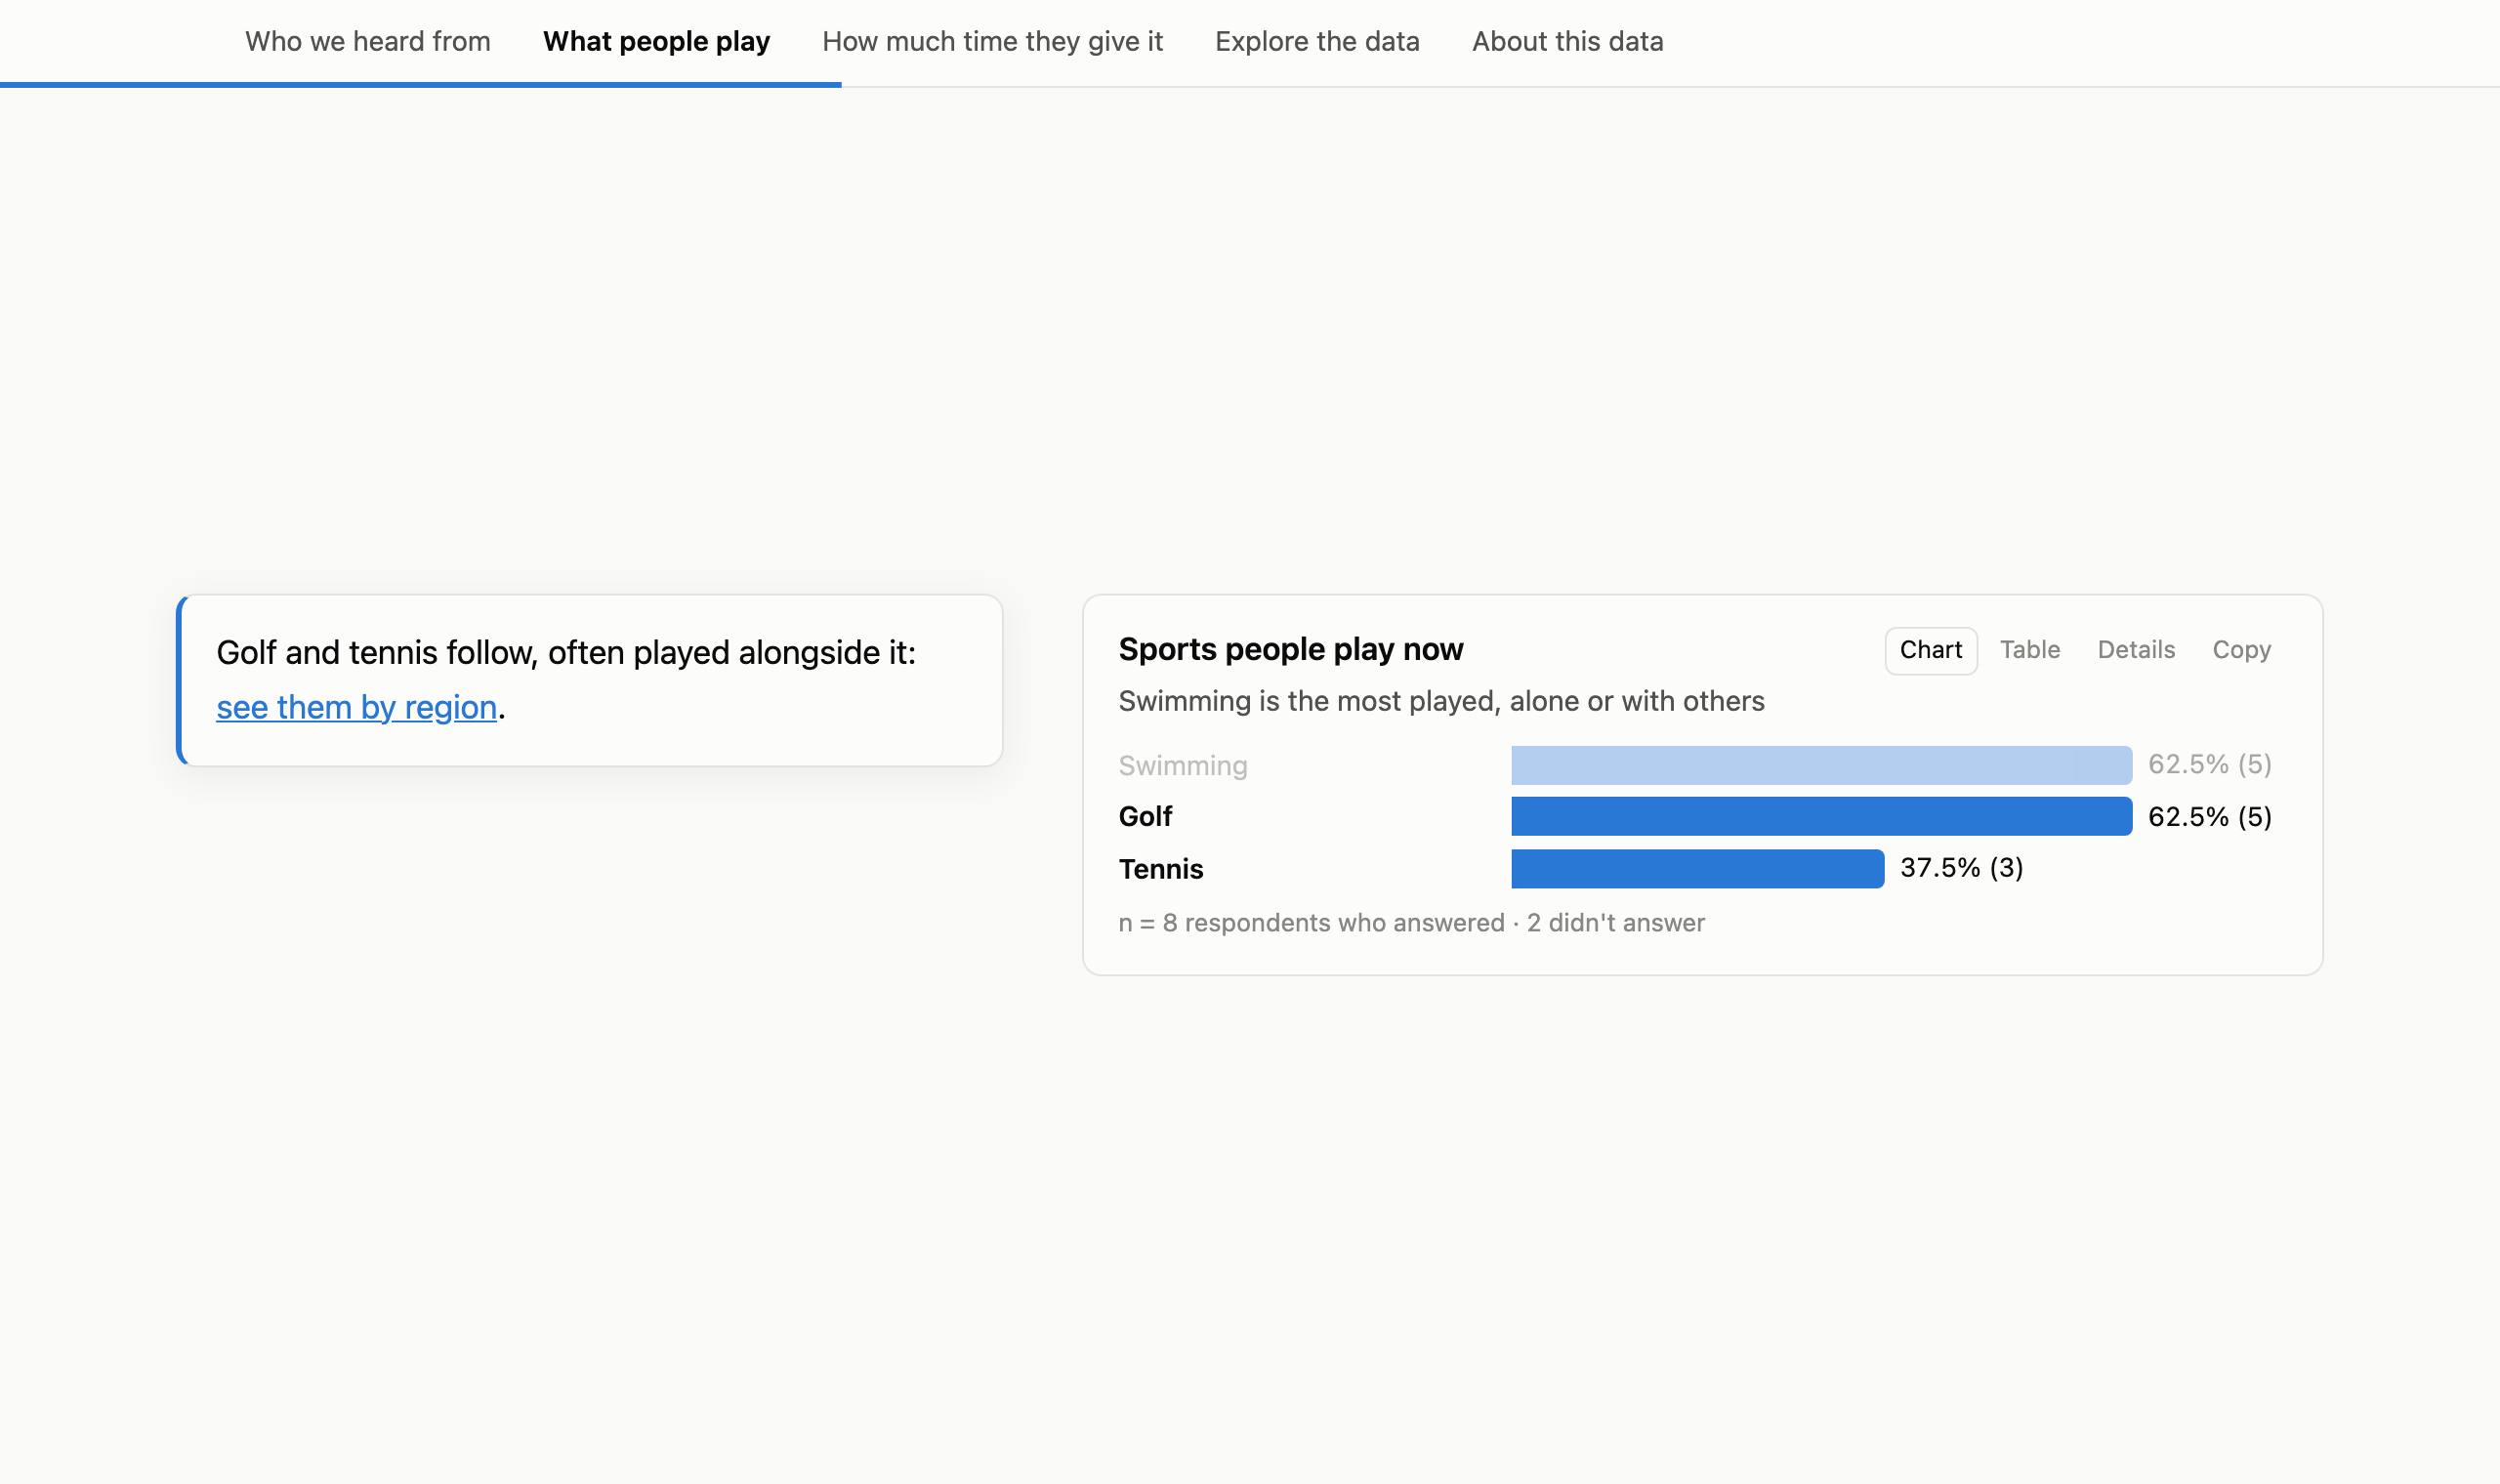
- Chapters. A cover with a standfirst, a byline, a date and optionally a photo; a chapter list that follows the reader and a progress bar; links to any chapter or step. Rows can run at reading width, wide or edge to edge, and a chart can have a subtitle, its point in a line. Text can be a lede, a callout, a caveat or a pull quote.
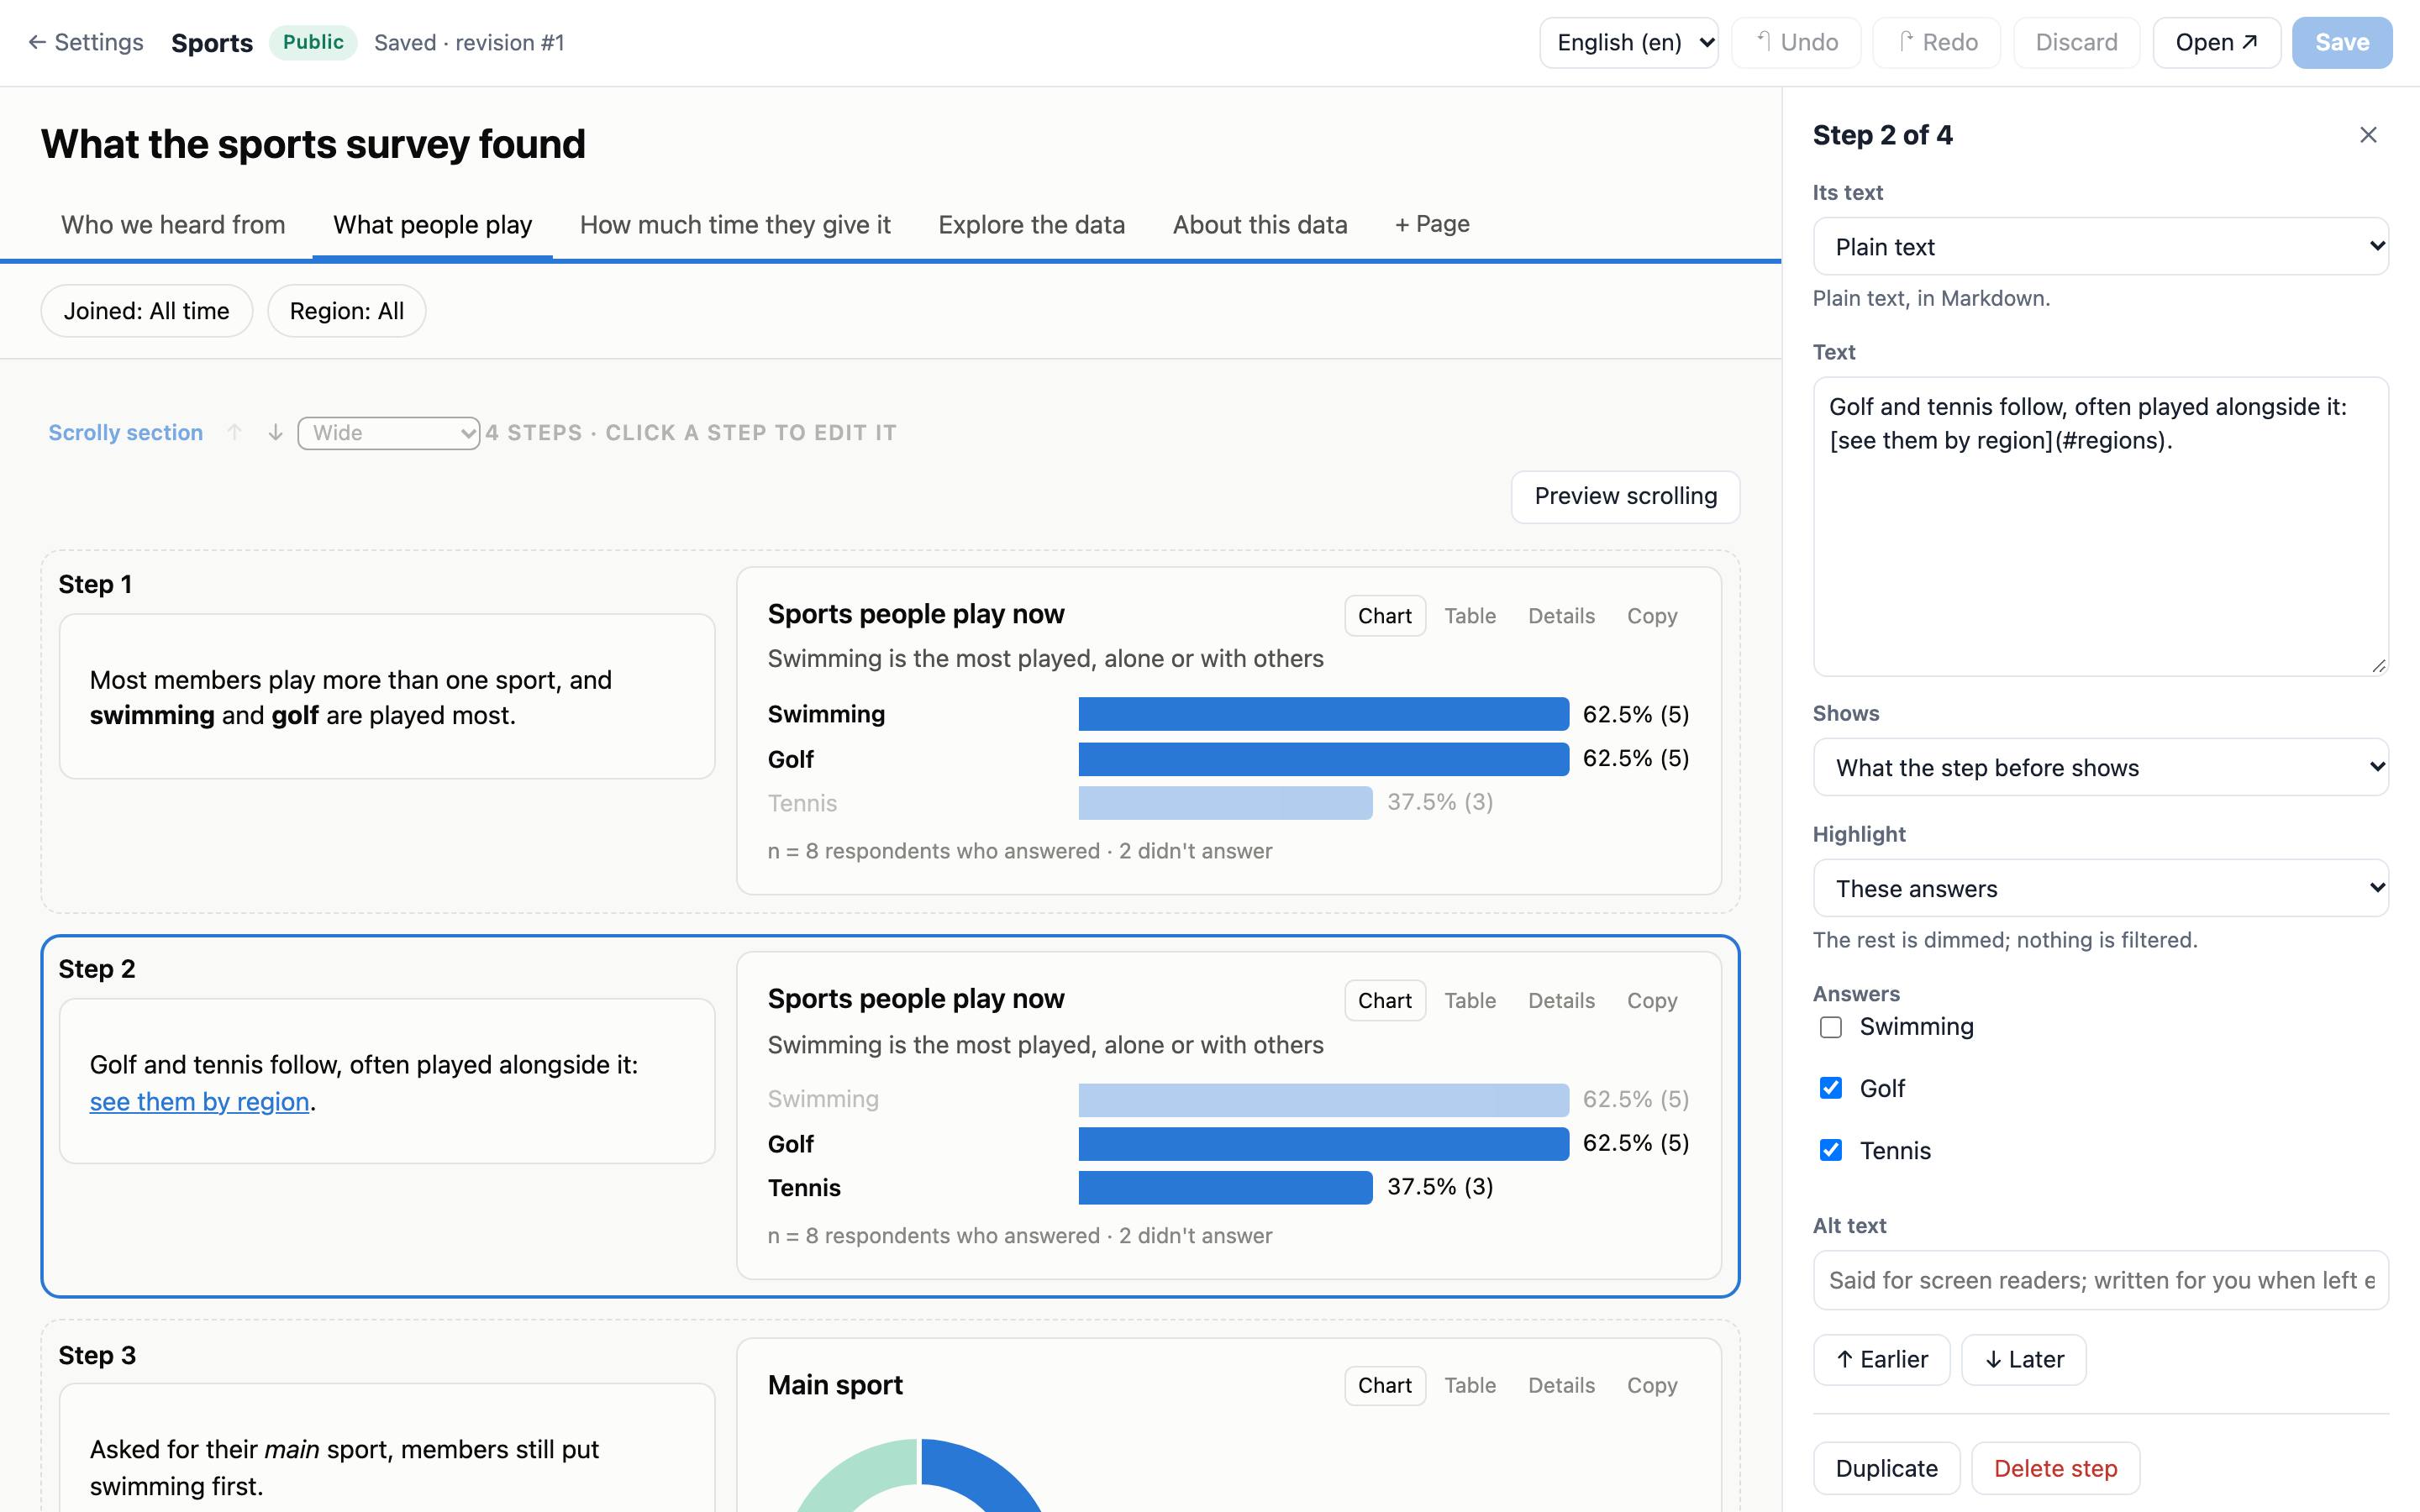
- Steps. Each step shows one of the section's charts and highlights answers: the most common ones (which follow the data), the ones you name, a range of a histogram or timeline, or areas of a map. Custom HTML in a section is told each step too.
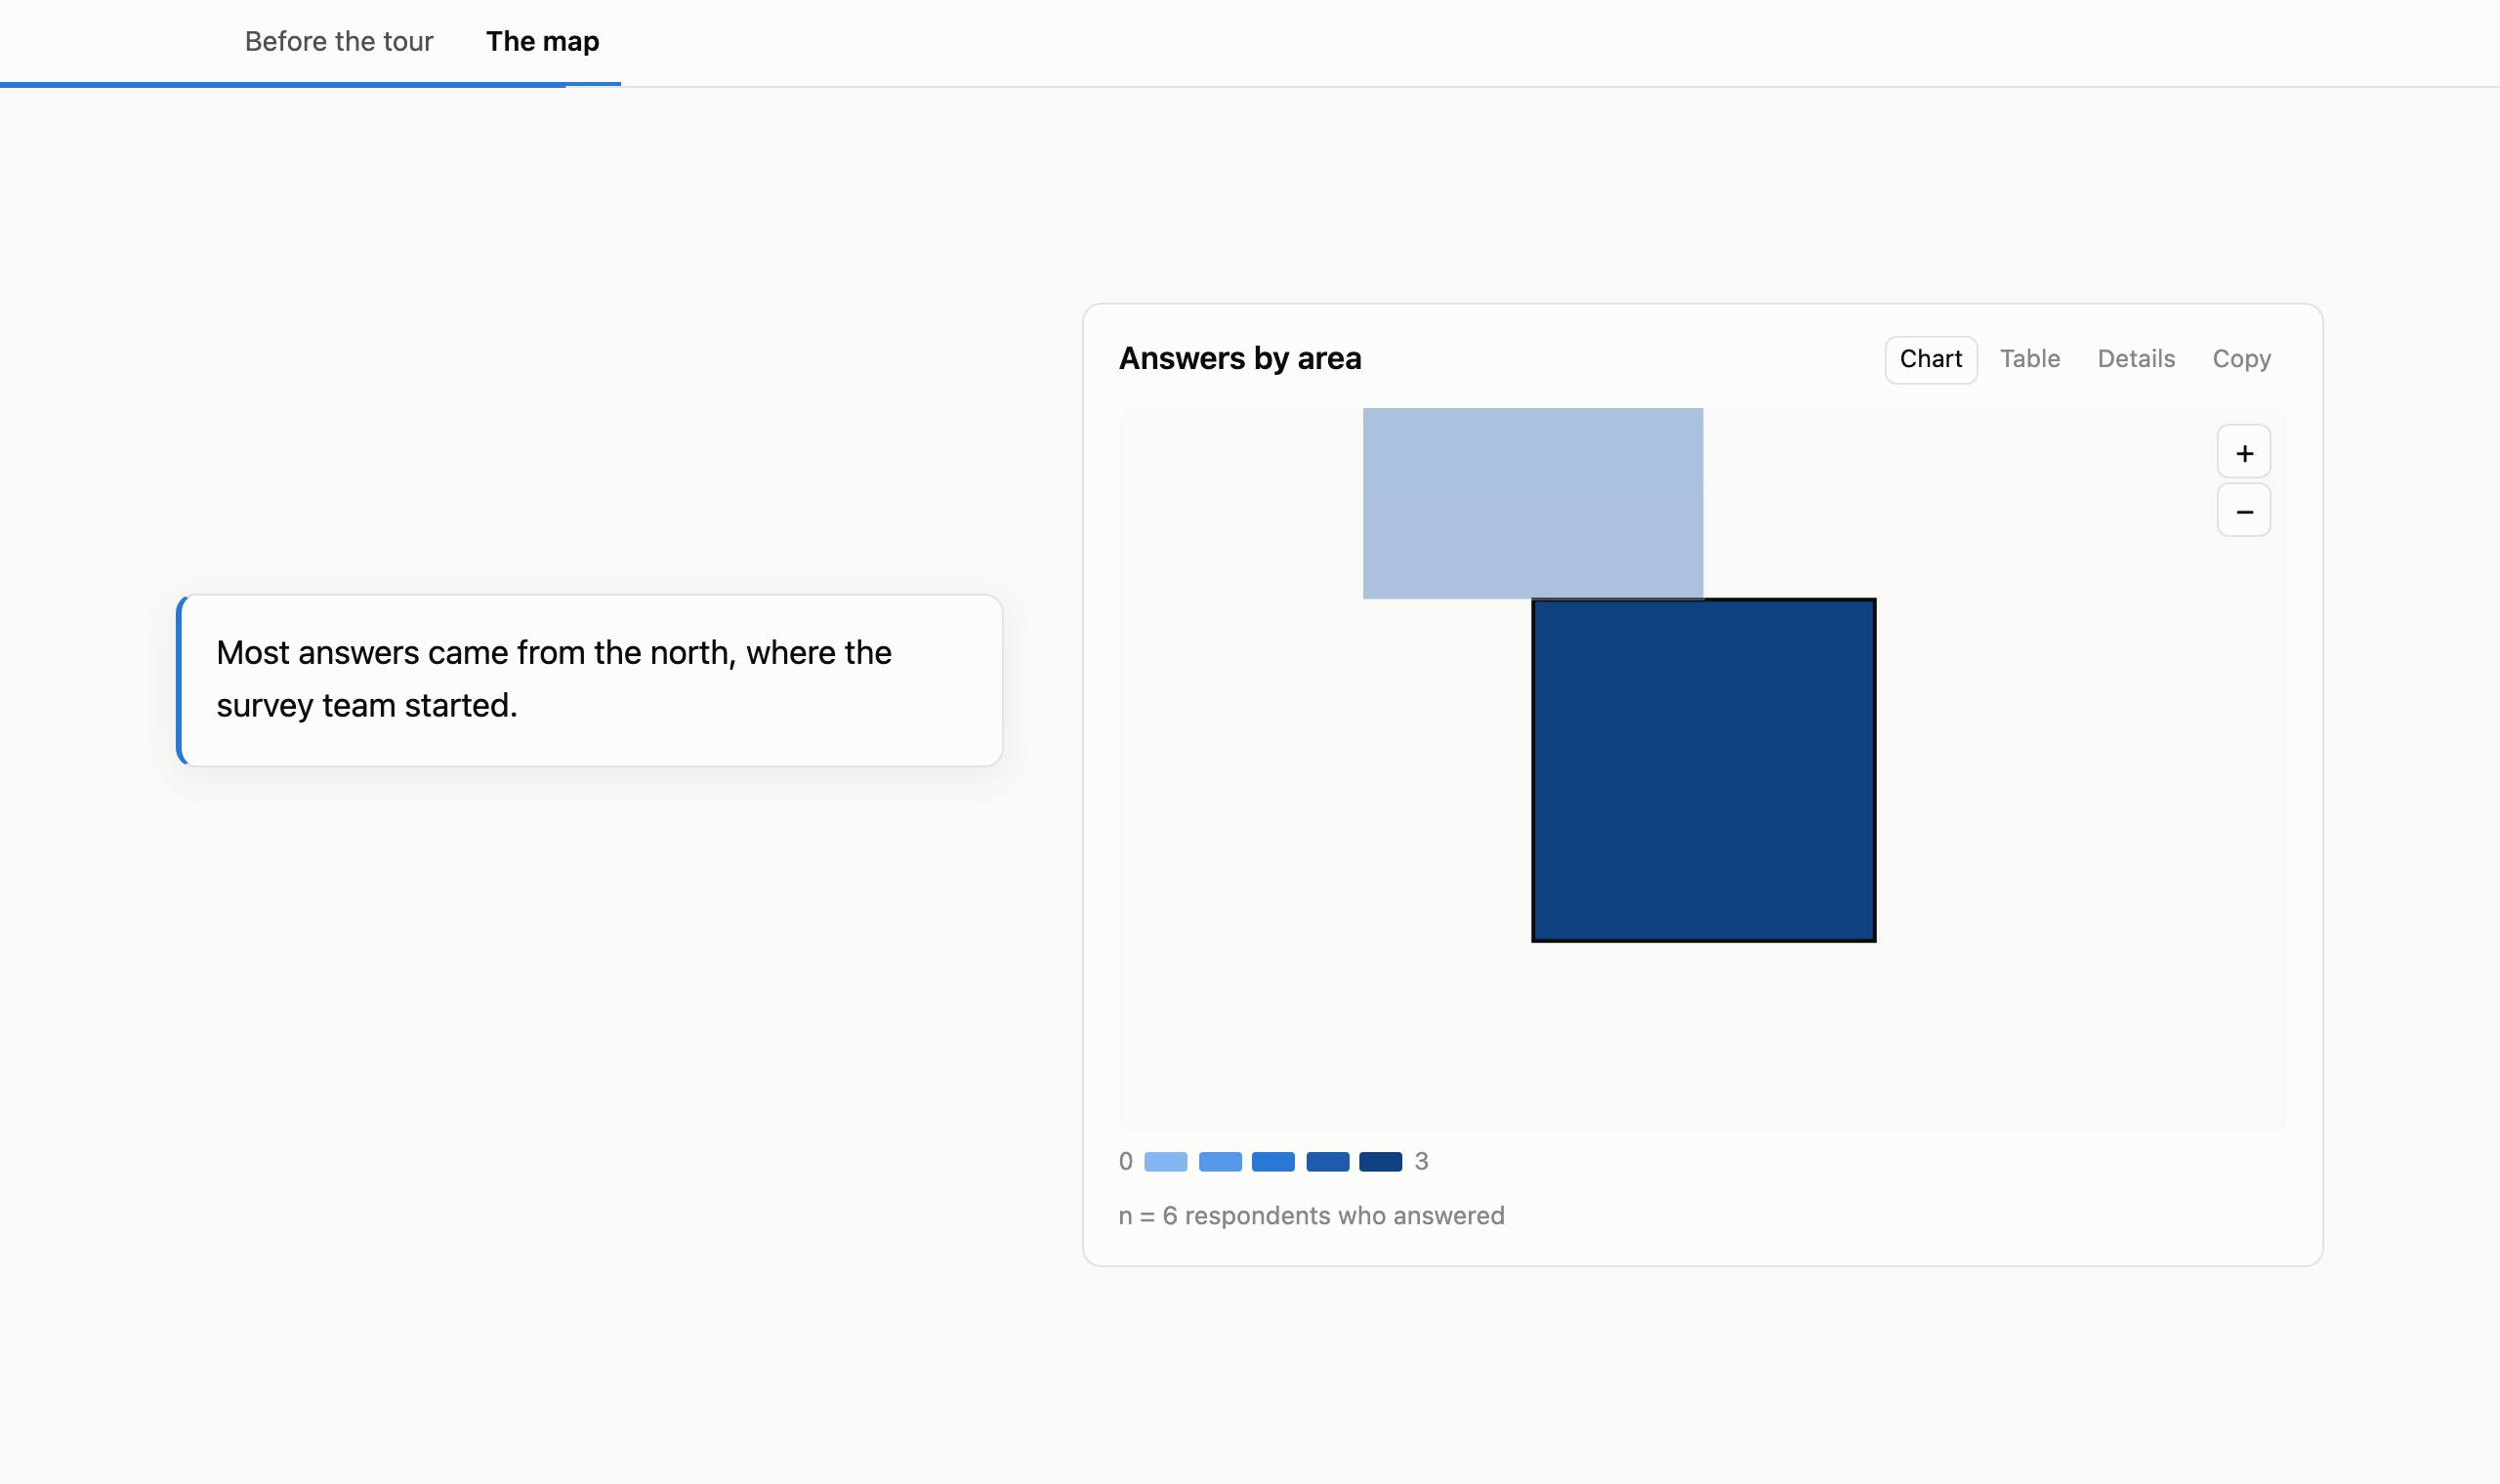
- Map tours. A step can move a map to an area, several areas or a box, and back to the whole map, easing between views; it stays there until a step moves it.
- Live, and honest about it. The numbers follow the data like any dashboard's, so write steps in words and let the charts show the numbers: a typed number would stay as written, and the editor flags it. Readers who arrive as data comes in see it update without losing their place.
- Sources beside the survey. A step's text can be a narrative: the survey's numbers live, other figures cited from your evidence library, numbered across the whole story with one list of sources at the end. A step can point at a source's figure on its chart. Narrative steps stay hidden from viewers until you publish them.
- Filters live in an explore chapter, laid out as a dashboard. Every other chapter shows all the data, so what its text says stays true. An About this data block says where the numbers come from.
- For everyone. On a phone the chart sits across the top with the text below it. Read as a list shows each step with its chart in that state, which is also how a story prints. Screen readers hear what each step changed, and reduced motion turns off the fades and map moves.
- Make one in the layout editor (Format: Story; then Add a scrolly section), or ask your assistant: the Write a story from a dashboard prompt has it propose an outline for you to approve first. Switching back to a dashboard keeps everything.
- Images are uploaded in the dashboard's settings, under Images. Each is re-encoded on upload, so what the camera recorded, a phone photo's location included, isn't kept. A public story's link preview shows its cover photo.
Live updates
- Each dashboard checks KoboToolbox for new, edited and deleted submissions every 5 or 15 minutes, every hour, every 6 hours, once a day, or only when you click Refresh now.
- Open dashboards update by themselves when new data arrives: numbers and bars move to their new values, filters and picks stay, and tables keep their page and say how many new rows came in.
- A layout change, from the editor or the assistant, also reaches open dashboards straight away.
- A tab in the background waits, and catches up when it's shown again.
What viewers see
Charts, numbers, tiles and area maps show counts and summaries, worked out on this site. Viewers' browsers never get the submissions themselves, only the numbers each widget needs.
Some widgets do show answers as written: table columns, charts and filters of free-text questions, point maps grouped to about 10 m or finer, usernames, and tooltip values on point maps or giving the most common free-text answer. The settings page lists them under Answers shown as written, and the assistant mentions them before making a dashboard public. Check that list, and the minimum group size, before you share.
Assistant tools
These come with the KoboToolbox connector. Reads tools only look; Changes tools change a dashboard; Deletes asks you to confirm first.
| Tool | What it does |
|---|---|
create_dashboard Changes | Make a dashboard of a project you own or manage: shows what it will share first, then shares it view-only with your dashboard account and lays it out. |
generate_dashboard_layout Changes | Replace a layout with one made from the form, for all questions or some, or with a story's outline. |
get_dashboard | A dashboard's settings, data status, layout, problems against the form and what it shows as written. |
list_dashboards | Your dashboards, with their links and access. |
add_dashboard_source Changes | Add another project you own or manage to a dashboard, such as a later round: shares it view-only with your dashboard account first. Combine them with a dataset (see preview_dataset). |
describe_dashboard_sources | Before combining a dashboard's projects: their questions side by side, which look the same and which codes differ, and which ids could link them, with how many match. |
preview_dataset | Try combining a dashboard's projects, such as rounds of one survey, or households linked to a registry by their id and to their members in a repeat group, and see what it finds (rows per round, codes that didn't match, duplicates merged, the share of ids that matched) before saving it. |
put_dashboard_table Changes | Store a small table the assistant wrote (targets per district, a code list) in your library. Lists of people are better uploaded under Tables in the admin page, so they don't pass through the chat. |
set_table_columns Changes | Fix a table's column kinds, labels or choice labels. |
list_dashboard_tables | Your tables, with their columns and first rows. |
add_dashboard_table Changes | Let a dashboard read one of your tables, to show it or join it to a project. |
remove_dashboard_source Changes | Stop a dashboard reading one of its projects. Nothing in KoboToolbox changes. |
update_dashboard Changes | Add, change, move or remove widgets, pages, filters and calculated fields; set the style; make it a story, with its chapters, scrolly sections and steps. |
set_dashboard_settings Changes | Make it public, password-protected or offline; how often it checks for new data. |
fetch_dashboard_boundaries Changes | Get a country's regions or districts, or the countries of the world, as a map layer. |
refresh_dashboard Changes | Check KoboToolbox for new data now. |
get_dashboard_data | The numbers a dashboard page shows right now. |
list_dashboard_revisions | A dashboard's layout history. |
revert_dashboard Changes | Bring back an earlier layout. |
save_evidence Changes | Save sources from desk research, and the findings that quote them, to your evidence library. |
list_evidence | Your evidence library, by theme or source. |
archive_evidence Changes | Stop a source or finding being cited (it can be restored). |
get_narrative_context | The survey's numbers as placeholders, the narratives and their problems, and your evidence. |
publish_narrative Changes | Publish narratives, after showing you how they read. |
withdraw_narrative Changes | Take a published narrative off the dashboard; its draft stays. |
delete_dashboard Deletes | Delete a dashboard and its copy of the data, after you confirm. KoboToolbox data is never touched. |
Limits
| What | Limit |
|---|---|
| KoboToolbox servers | Global (kf.kobotoolbox.org) and EU (eu.kobotoolbox.org) |
| Submissions per project | 100 000 |
| Checking for new data | At most every 5 minutes; Refresh now once a minute |
| Layout | 20 pages, 200 widgets, 6 widgets per row, 50 calculated fields |
| Questions in repeat groups | Through a dataset of the repeat group (see Combining projects) |
| Combining | 10 projects and tables per dashboard; 10 datasets; 300 000 rows read and 200 000 rows per dataset |
| Tables | CSV or TSV in UTF-8, under 10 MB, 50 000 rows and 200 columns; 5000 rows when the assistant stores one |
| Evidence library | 500 sources and 2,000 findings; quotes and claims of 1,000 characters |
| Narratives | 4,000 characters per language, 20 typed values, 5 reference markers per chart |
| Map layers | 5000 areas each; uploads under 3 MB; up to 10 countries per fetched layer |
| Logo | PNG, JPEG or WebP, under 200 KB |
| Images | JPEG, PNG or WebP, under 5 MB; 20 per dashboard; stored at 2400 px at most |
| Scrolly sections | 6 charts and 20 steps each |
| Cross-filtering | One pick per question, 5 at a time |
| Password attempts | 10 per 10 minutes from one place; a correct one lasts 7 days on that browser |
| Signing in here | 12 hours, then sign in again |
Security and privacy
- Your own KoboToolbox token never comes here. You sign in through the KoboToolbox connector, which tells this site who you are with a signed message that works once.
- The dashboard account's token is entered only in the settings page, stored encrypted, and decrypted only to read your shared projects. It is sent only to the KoboToolbox server it belongs to, and never shown again.
- Passwords are set only in the settings page, never through the assistant, and stored as one-way hashes.
- Locations stay here. Areas are worked out on this site, and geoBoundaries only gets the country codes you ask for.
- Street maps are OpenStreetMap tiles fetched by viewers' browsers: the tile server sees a viewer's address and the part of the map shown, not the answers or the dashboard's link.
- Custom HTML runs in a sandboxed frame that can't reach the network or this site's cookies, and gets only the numbers of the widgets it names.
- The pages load nothing from other sites, and the settings pages are protected against cross-site request forgery and framing.
Stop access
- One dashboard: take it offline, make a new link, or delete it. Deleting removes this site's copy of the data, never anything in KoboToolbox.
- One project: unshare it from your dashboard account in KoboToolbox. Its dashboards stop updating and show the last data they had.
- Everything: remove the dashboard account under Kobo access, or regenerate its token in KoboToolbox.
Help and troubleshooting
“Needs a dashboard account”
This site has no dashboard account for you yet. Make one and paste its token under Kobo access on your dashboards page.
“Dashboard account's token refused”
The token was regenerated or the account was removed. Sign in to KoboToolbox as the dashboard account, copy its current token, and paste it under Kobo access.
“No access to the project”
The project isn't shared with your dashboard account any more. Share it again in KoboToolbox with View submissions, or ask your assistant to.
“Project too large”
Dashboards read up to 100 000 submissions per project. The dashboard keeps the last data it had.
A widget says “Needs fixing”
The form changed since the widget was made: a question it uses was renamed, removed or changed type. Open the widget in the layout editor to pick another question, or ask your assistant to fix the dashboard.
Viewers see “This dashboard doesn't exist or is offline”
Check Who can see it in the settings. A dashboard set to password stays offline until a password is set, and an old link stops working once you make a new one.
The numbers differ from KoboToolbox
Look for the dashboard's settings: only approved submissions, the minimum group size, and filters or picks a viewer has set. New submissions arrive on the dashboard's schedule; Refresh now checks straight away.
Submissions show no area, or the wrong one
Locations outside every area of the layer, or with no GPS fix, have no area. Count them with “Count no answer as” on the chart. If your project spans several countries, fetch them into one layer. If the areas are too coarse, fetch a finer level.
My account is on another KoboToolbox server
Dashboards work with the Global and EU servers for now.
Where do I get help with KoboToolbox itself?
The KoboToolbox Help Center covers forms, projects and data, and the community forum is the place for questions.